Netstreit Investor Presentation Deck
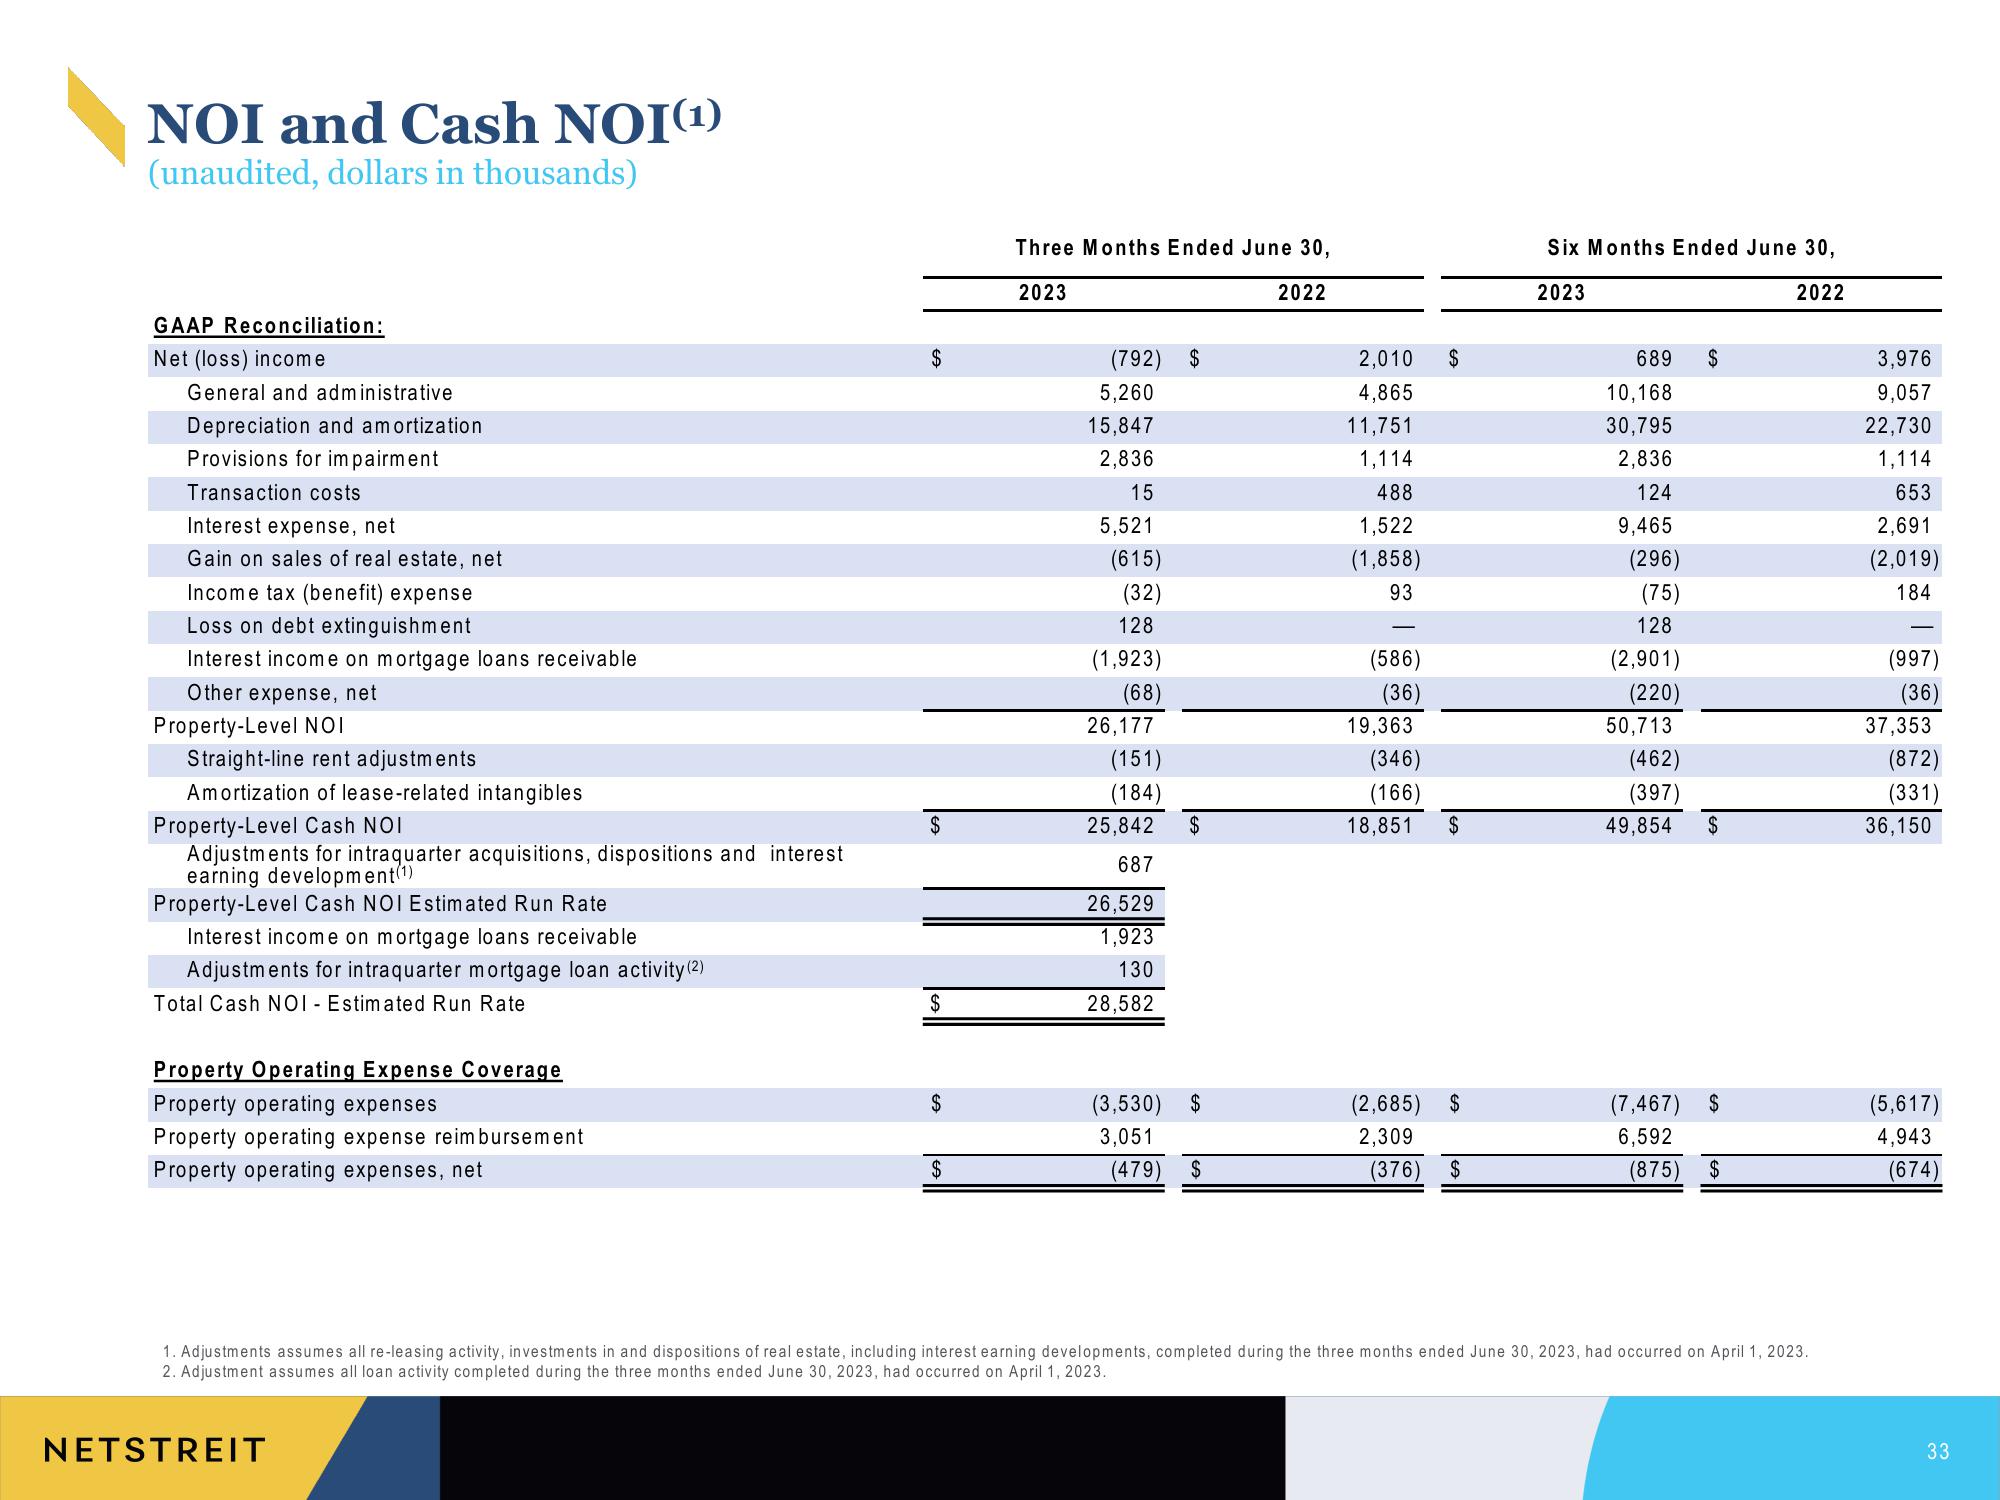
NOI and Cash NOI(¹)
(unaudited, dollars in thousands)
GAAP Reconciliation:
Net (loss) income
General and administrative
Depreciation and amortization
Provisions for impairment
Transaction costs
Interest expense, net
Gain on sales of real estate, net
Income tax (benefit) expense
Loss on debt extinguishment
Interest income on mortgage loans receivable
Other expense, net
Property-Level NOI
Straight-line rent adjustments
Amortization of lease-related intangibles
Property-Level Cash NOI
Adjustments for intraquarter acquisitions, dispositions and interest
earning development(¹)
Property-Level Cash NOI Estimated Run Rate
Interest income on mortgage loans receivable
Adjustments for intraquarter mortgage loan activity (2)
Total Cash NOI - Estimated Run Rate
Property Operating Expense Coverage
Property operating expenses
Property operating expense reimbursement
Property operating expenses, net
$
NETSTREIT
$
$
$
$
Three Months Ended June 30,
2023
2022
(792) $
5,260
15,847
2,836
15
5,521
(615)
(32)
128
(1,923)
(68)
26,177
(151)
(184)
25,842
687
26,529
1,923
130
28,582
$
(3,530) $
3,051
(479)
$
2,010
4,865
11,751
1,114
488
1,522
(1,858)
93
(586)
(36)
19,363
(346)
(166)
18,851
$
$
(2,685) $
2,309
(376) $
Six Months Ended June 30,
2023
2022
689 $
10,168
30,795
2,836
124
9,465
(296)
(75)
128
(2,901)
(220)
50,713
(462)
(397)
49,854
$
(7,467) $
6,592
(875) $
1. Adjustments assumes all re-leasing activity, investments in and dispositions of real estate, including interest earning developments, completed during the three months ended June 30, 2023, had occurred on April 1, 2023.
2. Adjustment assumes all loan activity completed during the three months ended June 30, 2023, had occurred on April 1, 2023.
3,976
9,057
22,730
1,114
653
2,691
(2,019)
184
(997)
(36)
37,353
(872)
(331)
36,150
(5,617)
4,943
(674)
33View entire presentation