Signify Health Investor Presentation Deck
Leading platform powering episodes of care in BPCI-A
-> $6.1B¹program spend under management in 2019
■
I
Claims and CMS data
EMR and practice management
system data
Signify's episode application data
(historical and benchmark data from
amassed episode volume)
1) As of, or for the year ended 2019.
Site of Care
signifyhealth.
Site of Game Utration by Procedur
Oynar
Improved patient outcomes...
Unnecessary readmissions
Days in acute or high-cost post acute facilities
Discharges home.
Days at home
... and results for value-based participants
Shared savings for participating providers and Signify
NOF
Capture
Data
Improve
Outcomes
2
AAE Savings Opportunity Across Episodes
Episode Name
Hip Replacement
& Hip Revision
Knee Arthroscopy
Knee Replaceme Program Performance
Knee Revision
Lumbar Laminec
Lumbar Spine Fu
Generate
Insights
Deliver
Actions
Episodes
3000
60
Episodes per Month
556 (avg/mth
■
■
■
Episodes with on AAF Sovings
Opportunity
10
10
Discharged to SNE
10.1%
SNF Days
9.8 Days
17.4
Bere
3,337
pi
Episodes wa Readmission
21:2%
1.1%
189
314
JUN
B
TOU
Se
$35,000
$35,000
707
10 Day Readin
OFF Boy 19
PAIN 110 DE TR
JA
I
■
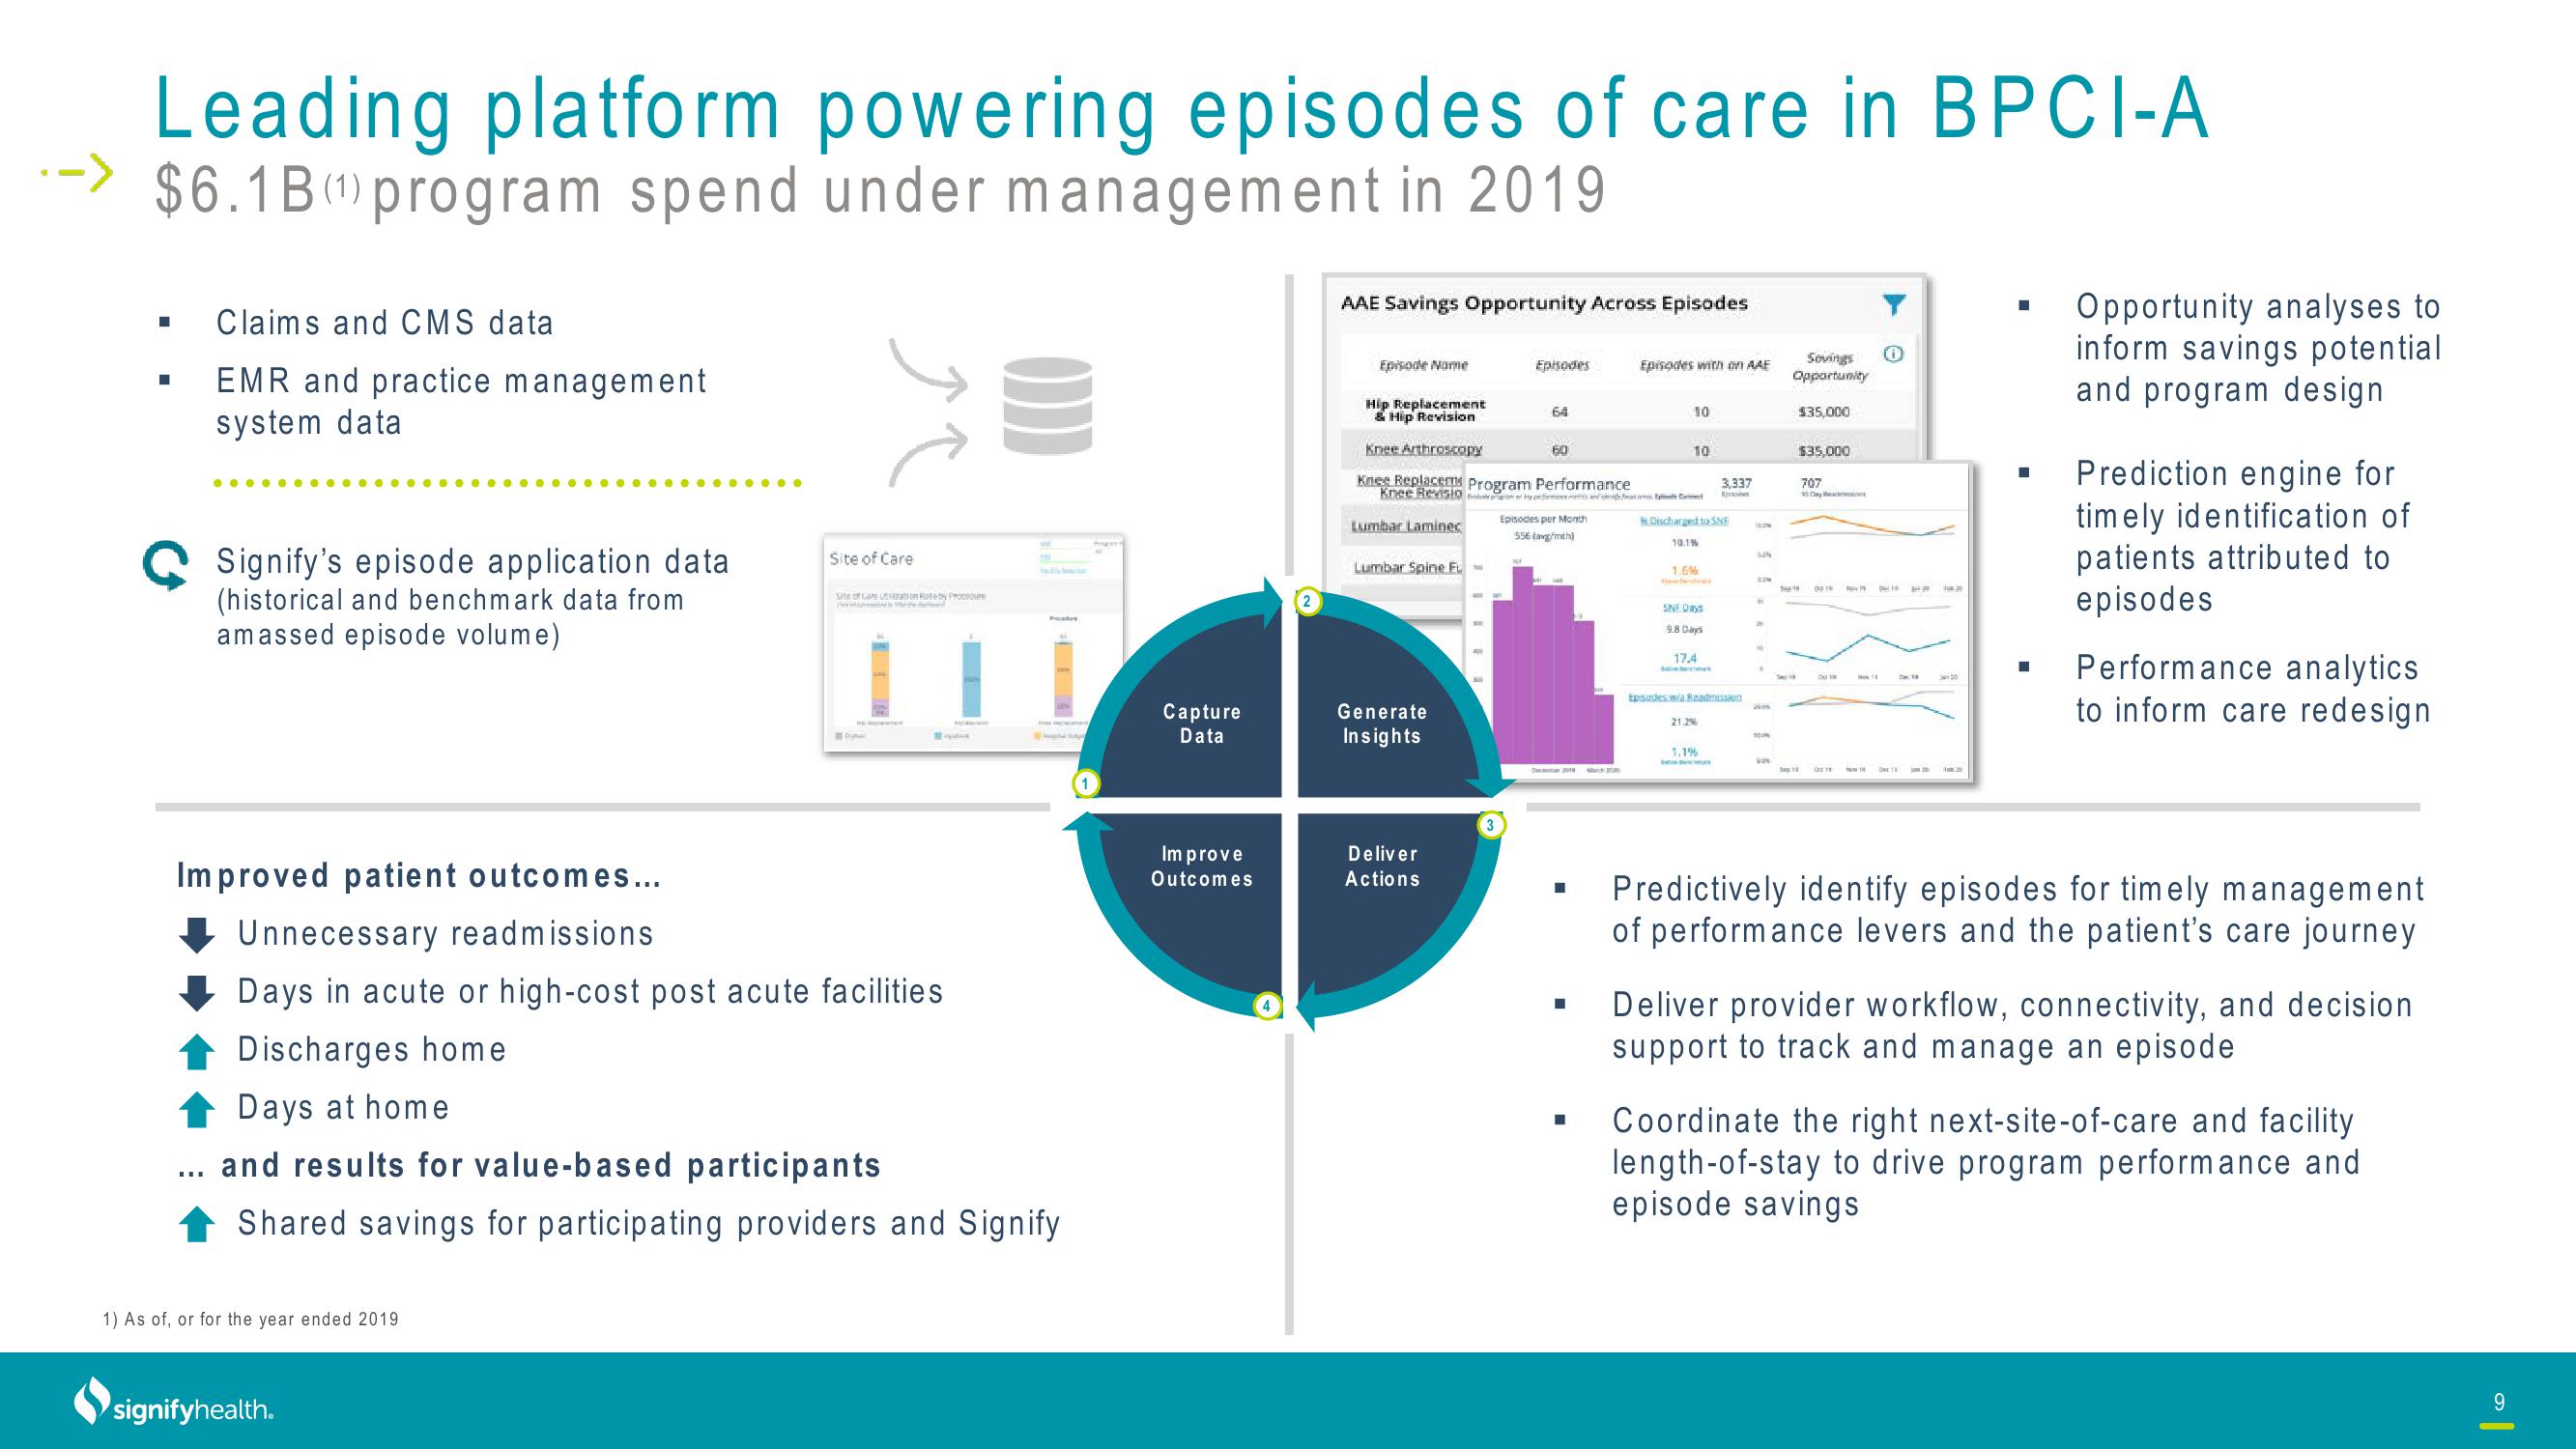
Opportunity analyses to
inform savings potential
and program design
Prediction engine for
timely identification of
patients attributed to
episodes
Performance analytics
to inform care redesign
Predictively identify episodes for timely management
of performance levers and the patient's care journey
Deliver provider workflow, connectivity, and decision
support to track and manage an episode
Coordinate the right next-site-of-care and facility
length-of-stay to drive program performance and
episode savings
9View entire presentation