BigCommerce Results Presentation Deck
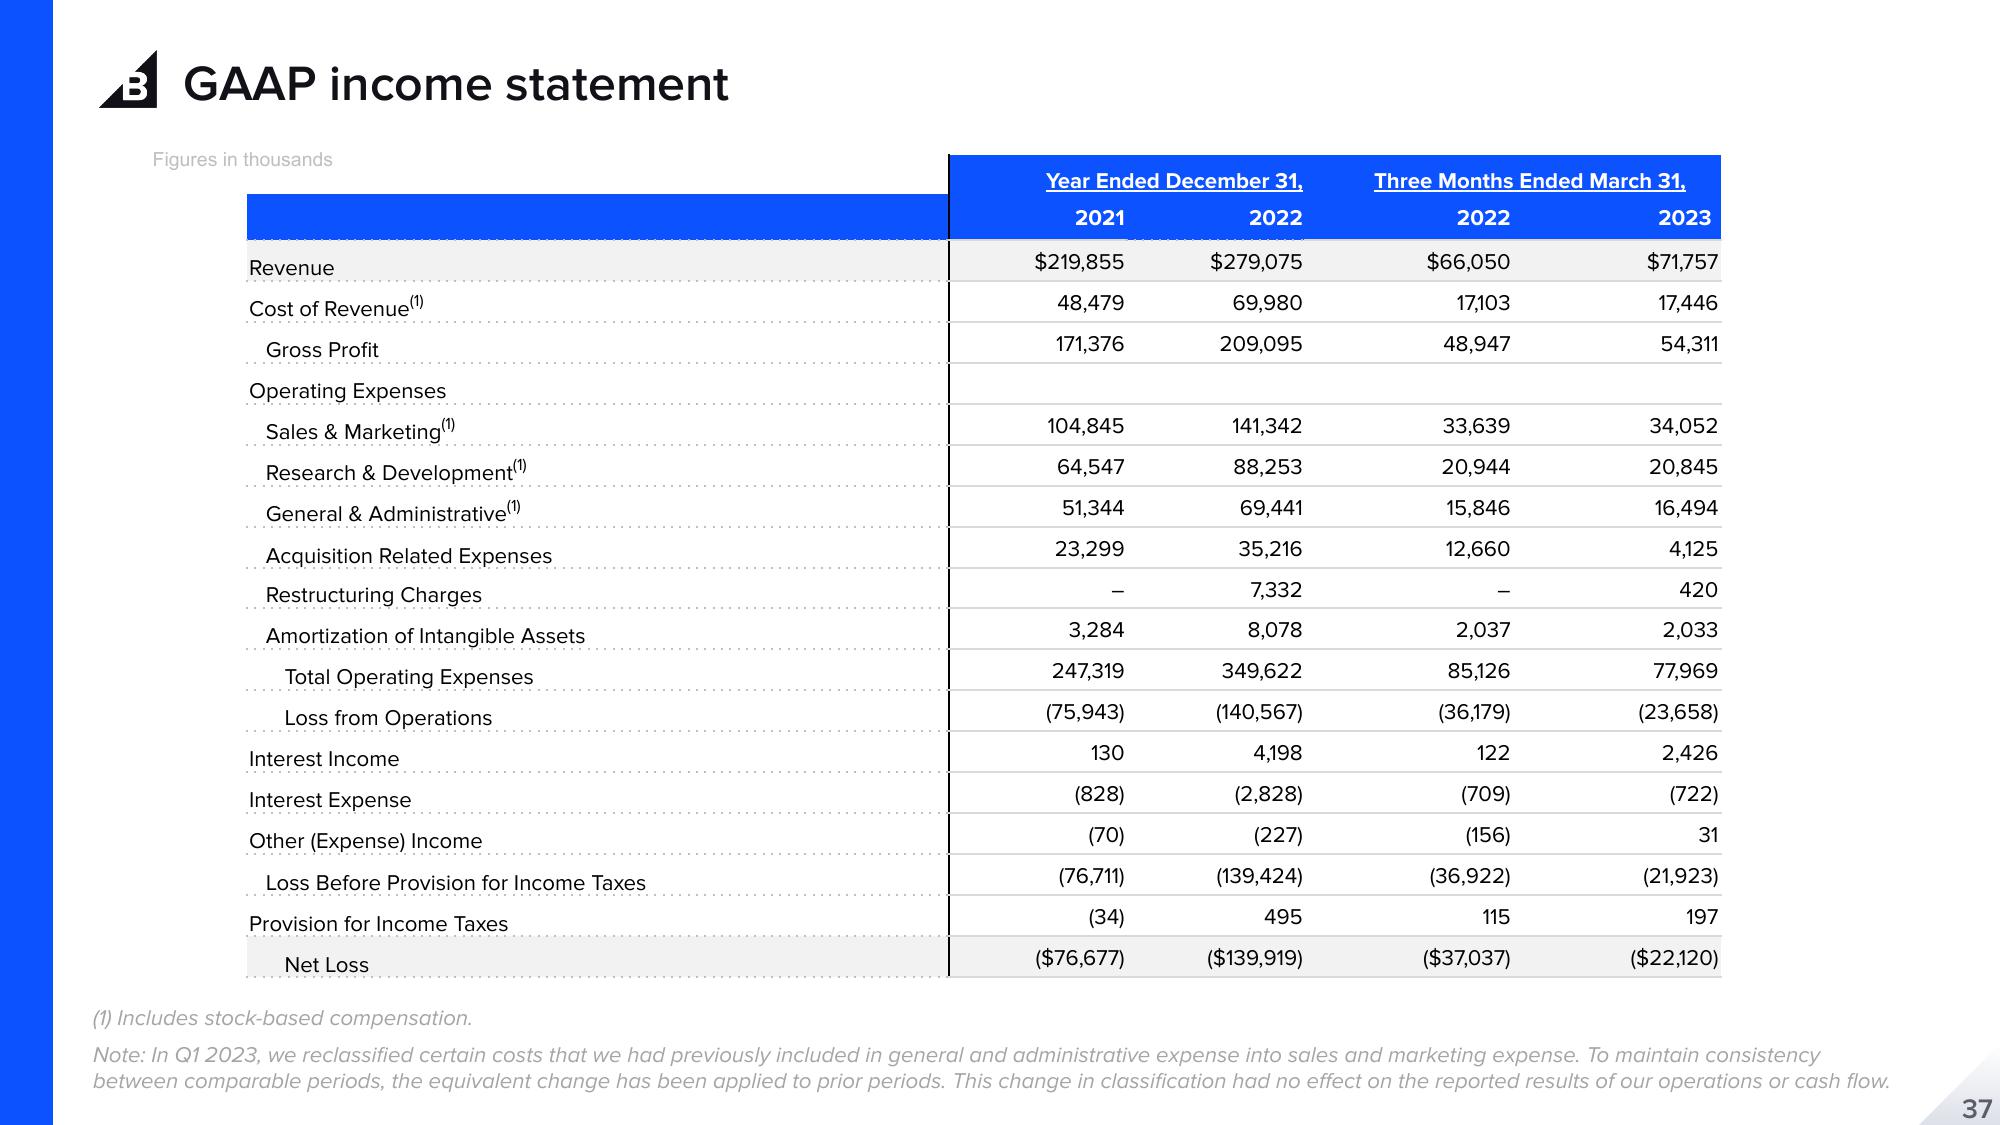
GAAP income statement
Figures in thousands
Revenue
Cost of Revenue (¹)
Gross Profit
Operating Expenses
Sales & Marketing (¹)
Research & Development (¹)
General & Administrative (¹)
Acquisition Related Expenses
Restructuring Charges
Amortization of Intangible Assets
Total Operating Expenses
Loss from Operations
Interest Income
Interest Expense
Other (Expense) Income
Loss Before Provision for Income Taxes
Provision for Income Taxes
Net Loss
Year Ended December 31,
2022
2021
$219,855
48,479
171,376
104,845
64,547
51,344
23,299
3,284
247,319
(75,943)
130
(828)
(70)
(76,711)
(34)
($76,677)
$279,075
69,980
209,095
141,342
88,253
69,441
35,216
7,332
8,078
349,622
(140,567)
4,198
(2,828)
(227)
(139,424)
495
($139,919)
Three Months Ended March 31,
2022
2023
$66,050
17,103
48,947
33,639
20,944
15,846
12,660
2,037
85,126
(36,179)
122
(709)
(156)
(36,922)
115
($37,037)
$71,757
17,446
54,311
34,052
20,845
16,494
4,125
420
2,033
77,969
(23,658)
2,426
(722)
31
(21,923)
197
($22,120)
(1) Includes stock-based compensation.
Note: In Q1 2023, we reclassified certain costs that we had previously included in general and administrative expense into sales and marketing expense. To maintain consistency
between comparable periods, the equivalent change has been applied to prior periods. This change in classification had no effect on the reported results of our operations or cash flow.
37View entire presentation