Lazard Investor Presentation Deck
INVESTOR PRESENTATION
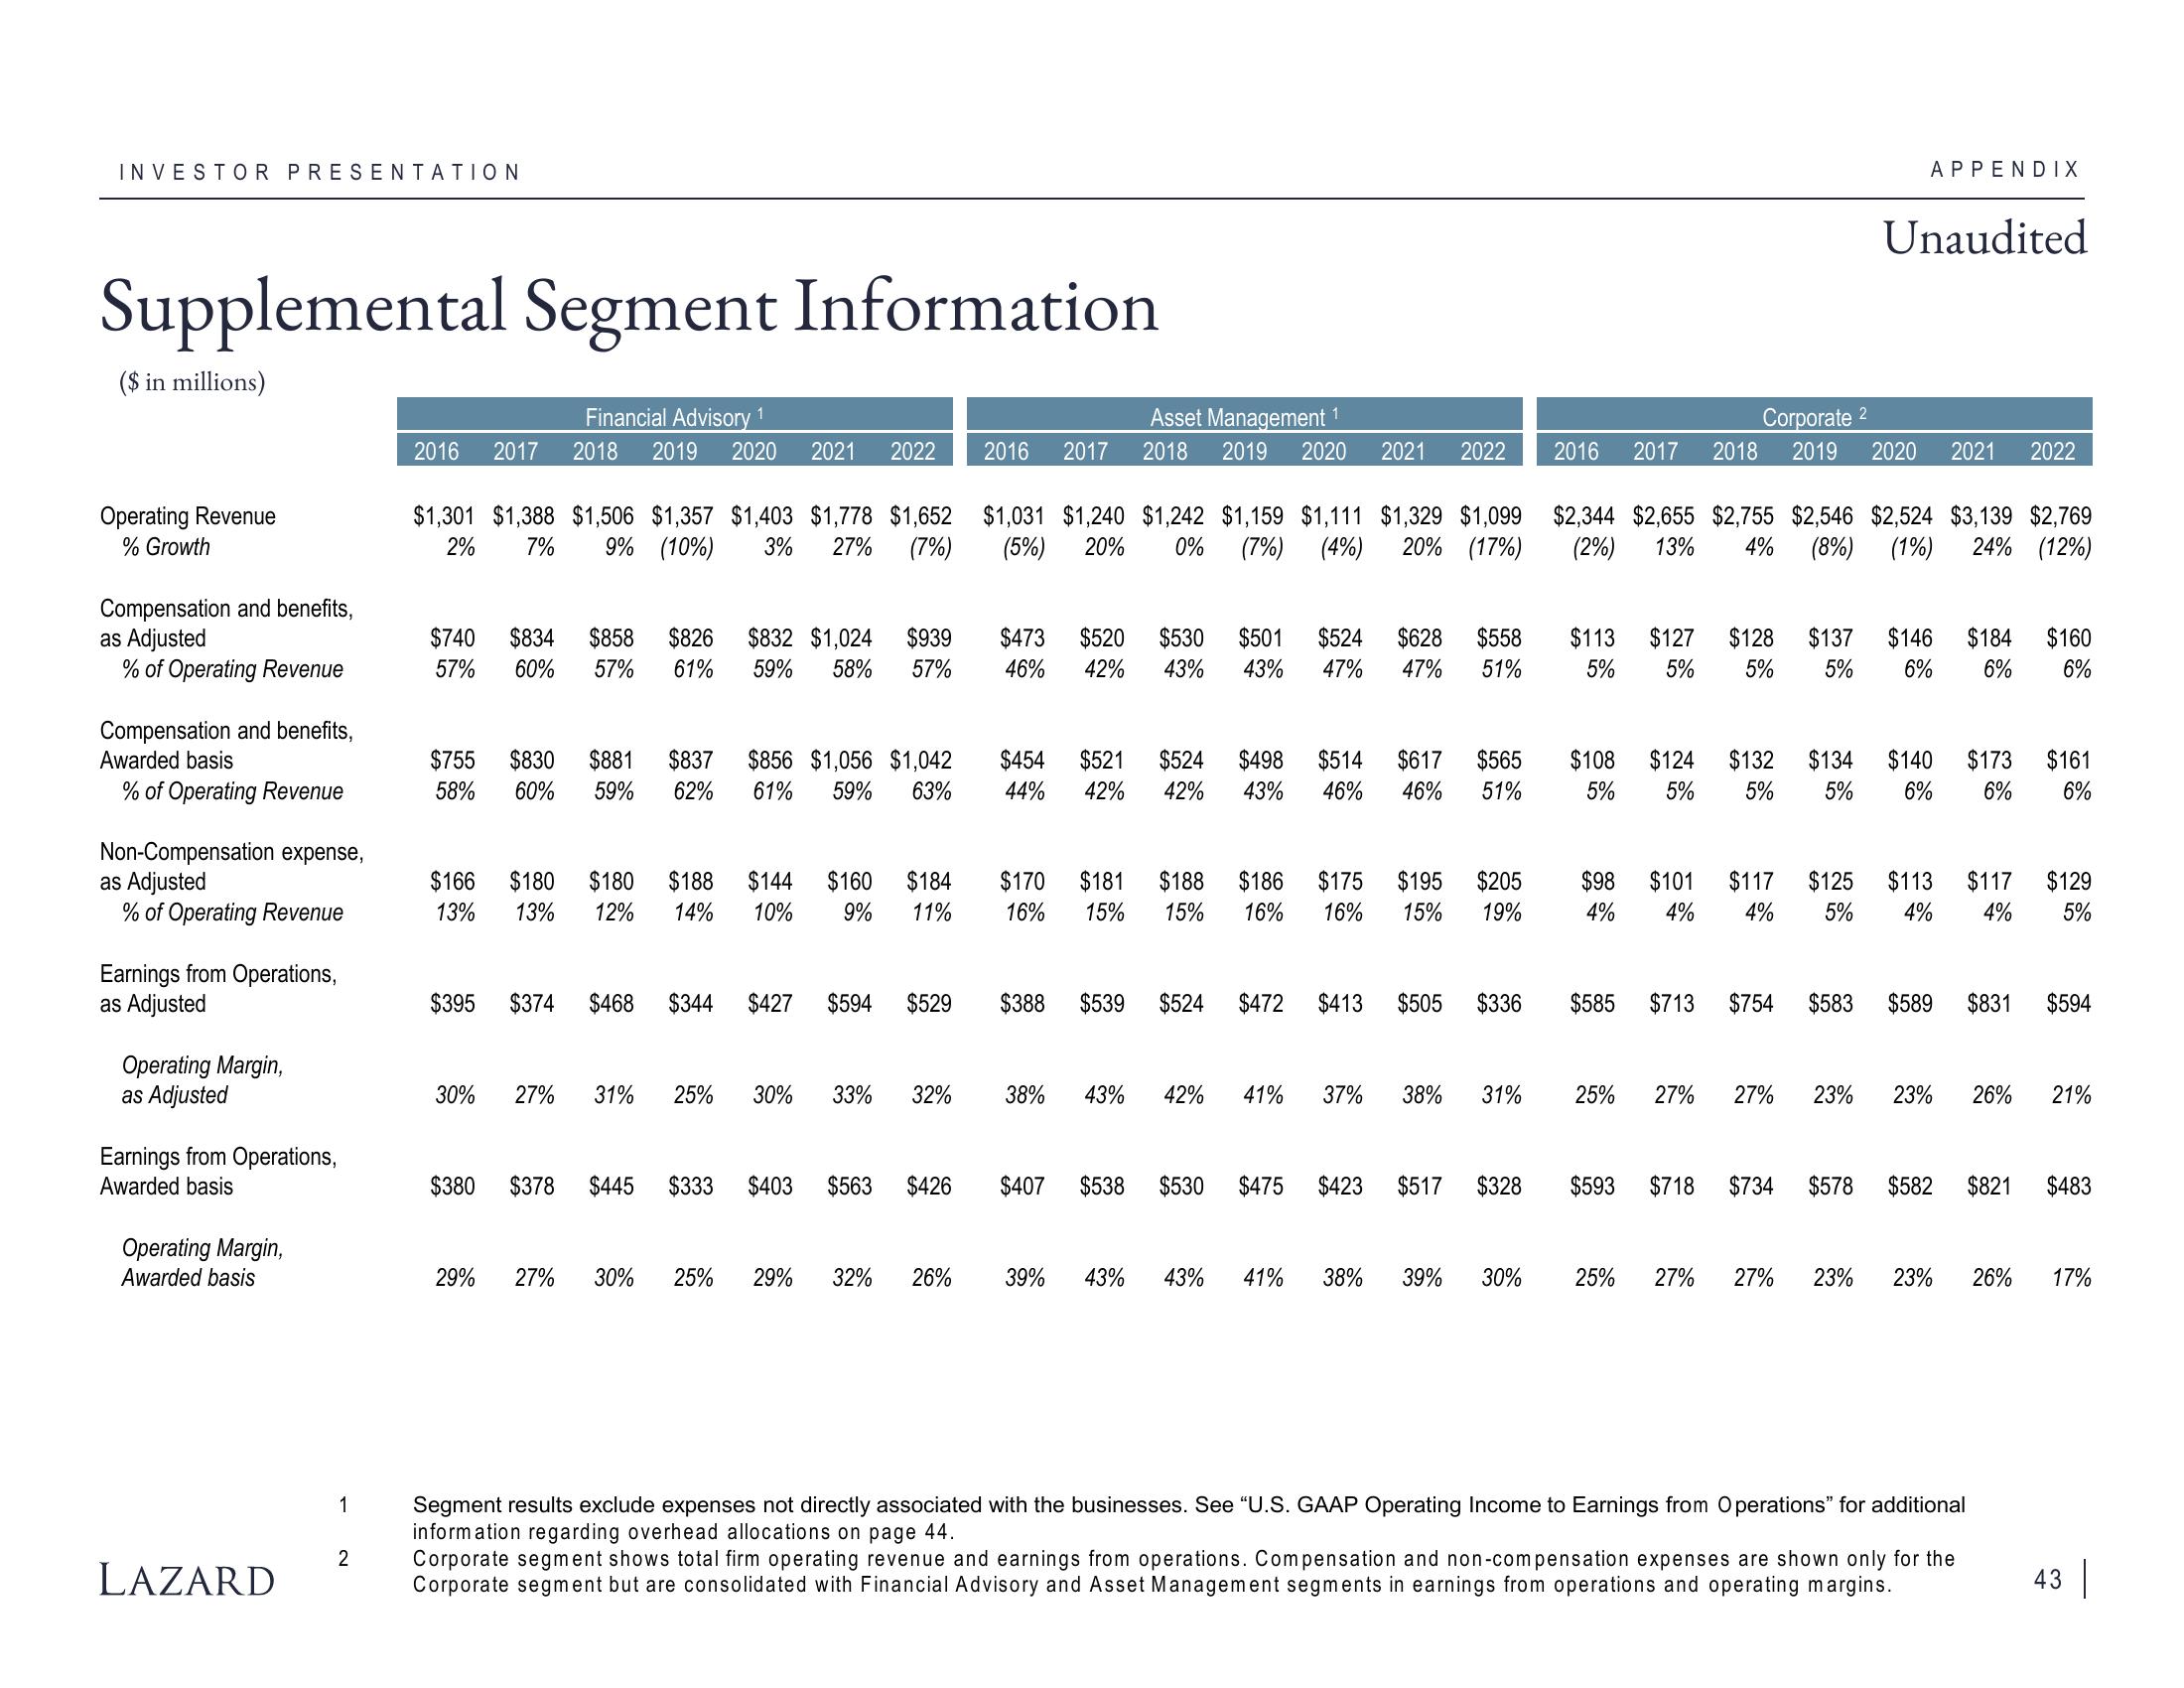
Supplemental Segment Information
($ in millions)
Operating Revenue
% Growth
Compensation and benefits,
as Adjusted
% of Operating Revenue
Compensation and benefits,
Awarded basis
% of Operating Revenue
Non-Compensation expense,
as Adjusted
% of Operating Revenue
Earnings from Operations,
as Adjusted
Operating Margin,
as Adjusted
Earnings from Operations,
Awarded basis
Operating Margin,
Awarded basis
LAZARD
1
2
Financial Advisory 1
2016 2017 2018 2019 2020 2021 2022
$1,301 $1,388 $1,506 $1,357 $1,403 $1,778 $1,652
2% 7% 9% (10%) 3% 27% (7%)
$740 $834 $858
57% 60% 57%
$755 $830 $881 $837
58% 60% 59% 62%
$166 $180 $180
13% 13% 12%
$395
30%
$380
$826 $832 $1,024 $939
61% 59% 58% 57%
$856 $1,056 $1,042
61% 59%
63%
$188 $144 $160 $184
14% 10% 9%
11%
$374 $468 $344 $427
29% 27% 30%
27% 31% 25% 30%
$378 $445 $333 $403
$594
33% 32%
$563
$529
29% 32%
$426
26%
Asset Management 1
2016 2017 2018 2019 2020 2021 2022
$1,031 $1,240 $1,242 $1,159 $1,111 $1,329 $1,099
(5%) 20% 0% (7%) (4%) 20% (17%)
$473 $520 $530 $501
46% 42% 43% 43%
$454 $521 $524 $498 $514 $617 $565
44% 42% 42% 43% 46% 46% 51%
$170 $181 $188 $186 $175
16%
$195
15% 15% 16% 16% 15%
$388 $539 $524 $472
$524 $628 $558
47% 47% 51%
38% 43% 42%
41%
$407 $538 $530 $475
$413
37%
$423
$505
$205
19%
$336
38% 31%
$517 $328
Corporate 2
2016 2017 2018 2019 2020 2021 2022
$113 $127 $128 $137
5% 5% 5% 5%
$2,344 $2,655 $2,755 $2,546 $2,524 $3,139 $2,769
(2%) 13% 4% (8%) (1%) 24% (12%)
$108 $124 $132 $134
5% 5% 5% 5%
$98 $101
4% 4%
$585 $713
25% 27%
$593 $718
39% 43% 13% 41% 38% 39% 30% 25% 27%
$117
4%
$754
27%
APPENDIX
$125
5%
Unaudited
$734 $578
$146 $184 $160
6% 6% 6%
$140 $173
6%
6%
$583 $589
$113 $117
$129
4% 4% 5%
23% 23% 26% 21%
$161
6%
$831 $594
$582 $821 $483
27% 23% 23% 26%
Segment results exclude expenses not directly associated with the businesses. See "U.S. GAAP Operating Income to Earnings from Operations" for additional
information regarding overhead allocations on page 44.
Corporate segment shows total firm operating revenue and earnings from operations. Compensation and non-compensation expenses are shown only for the
Corporate segment but are consolidated with Financial Advisory and Asset Management segments in earnings from operations and operating margins.
17%
43View entire presentation