Polestar SPAC Presentation Deck
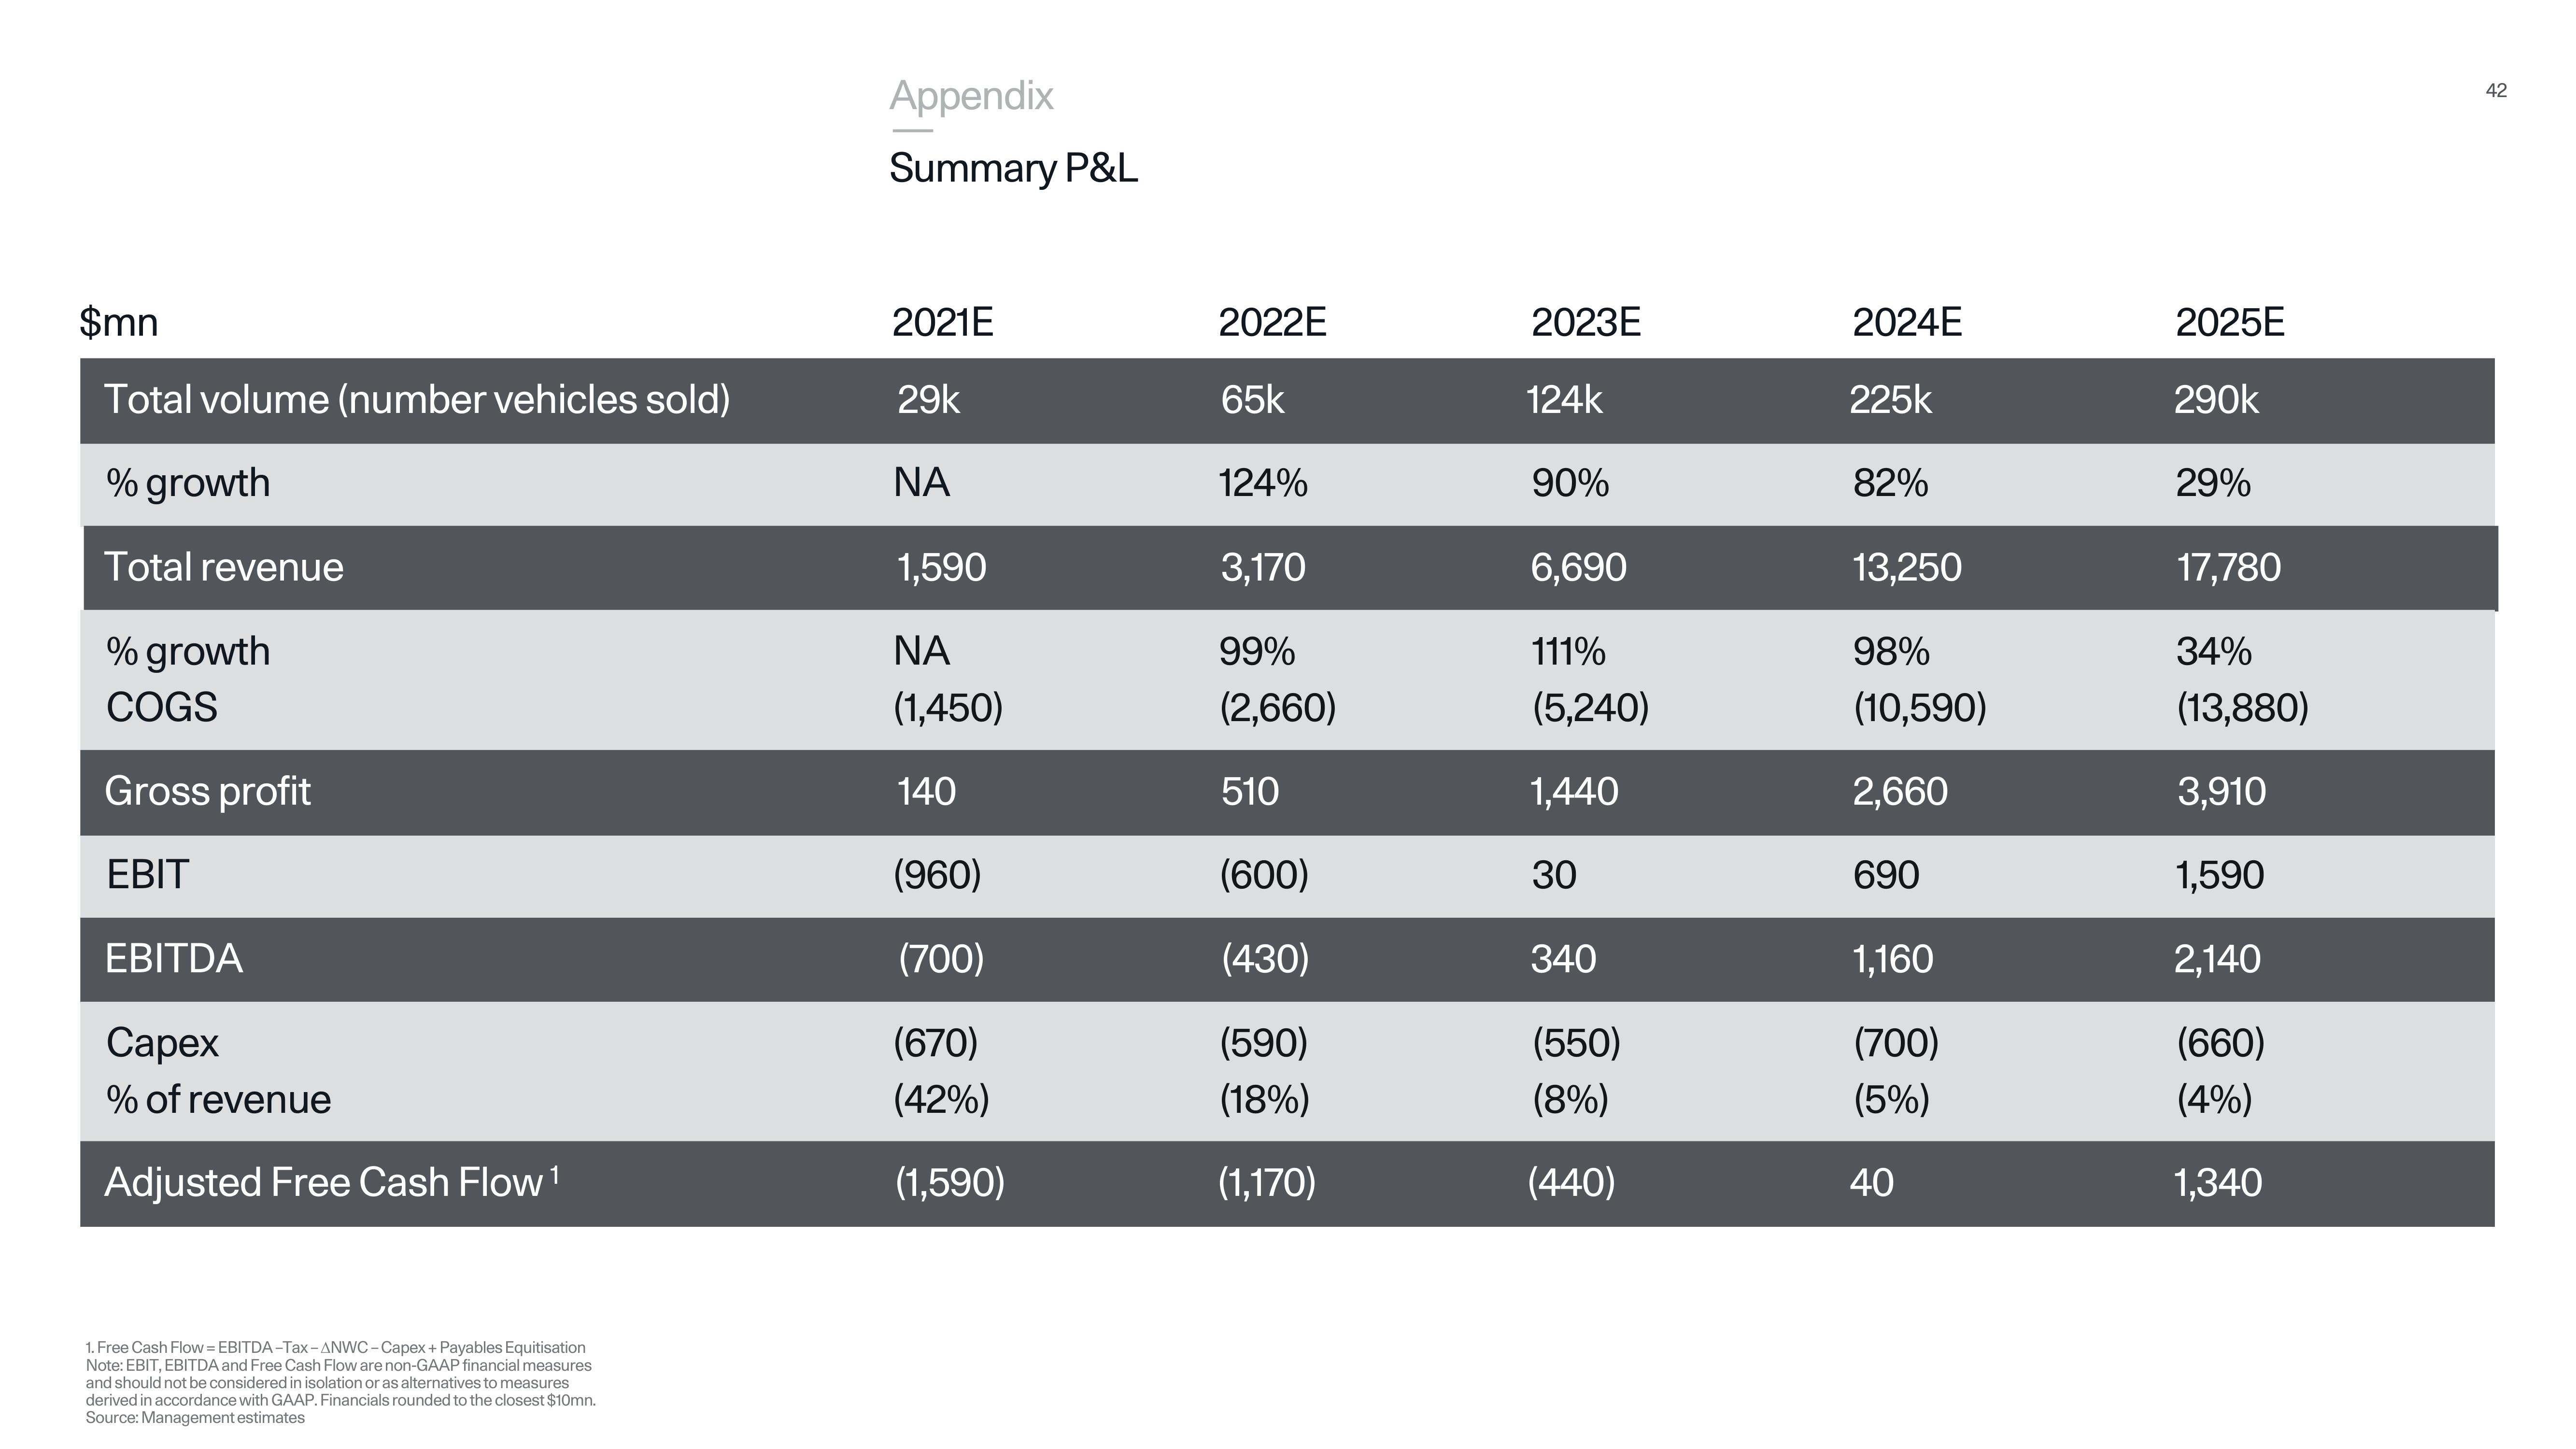
$mn
Total volume (number vehicles sold)
% growth
Total revenue
% growth
COGS
Gross profit
EBIT
EBITDA
Capex
% of revenue
Adjusted Free Cash Flow ¹
1. Free Cash Flow = EBITDA-Tax-ANWC-Capex + Payables Equitisation
Note: EBIT, EBITDA and Free Cash Flow are non-GAAP financial measures
and should not be considered in isolation or as alternatives to measures
derived in accordance with GAAP. Financials rounded to the closest $10mn.
Source: Management estimates
Appendix
Summary P&L
2021E
29k
ΝΑ
1,590
ΝΑ
(1,450)
140
(960)
(700)
(670)
(42%)
(1,590)
2022E
65k
124%
3,170
99%
(2,660)
510
(600)
(430)
(590)
(18%)
(1,170)
2023E
124k
90%
6,690
111%
(5,240)
1,440
30
340
(550)
(8%)
(440)
2024E
225k
82%
13,250
98%
(10,590)
2,660
690
1,160
(700)
(5%)
40
2025E
290k
29%
17,780
34%
(13,880)
3,910
1,590
2,140
(660)
(4%)
1,340
42View entire presentation