GMS Results Presentation Deck
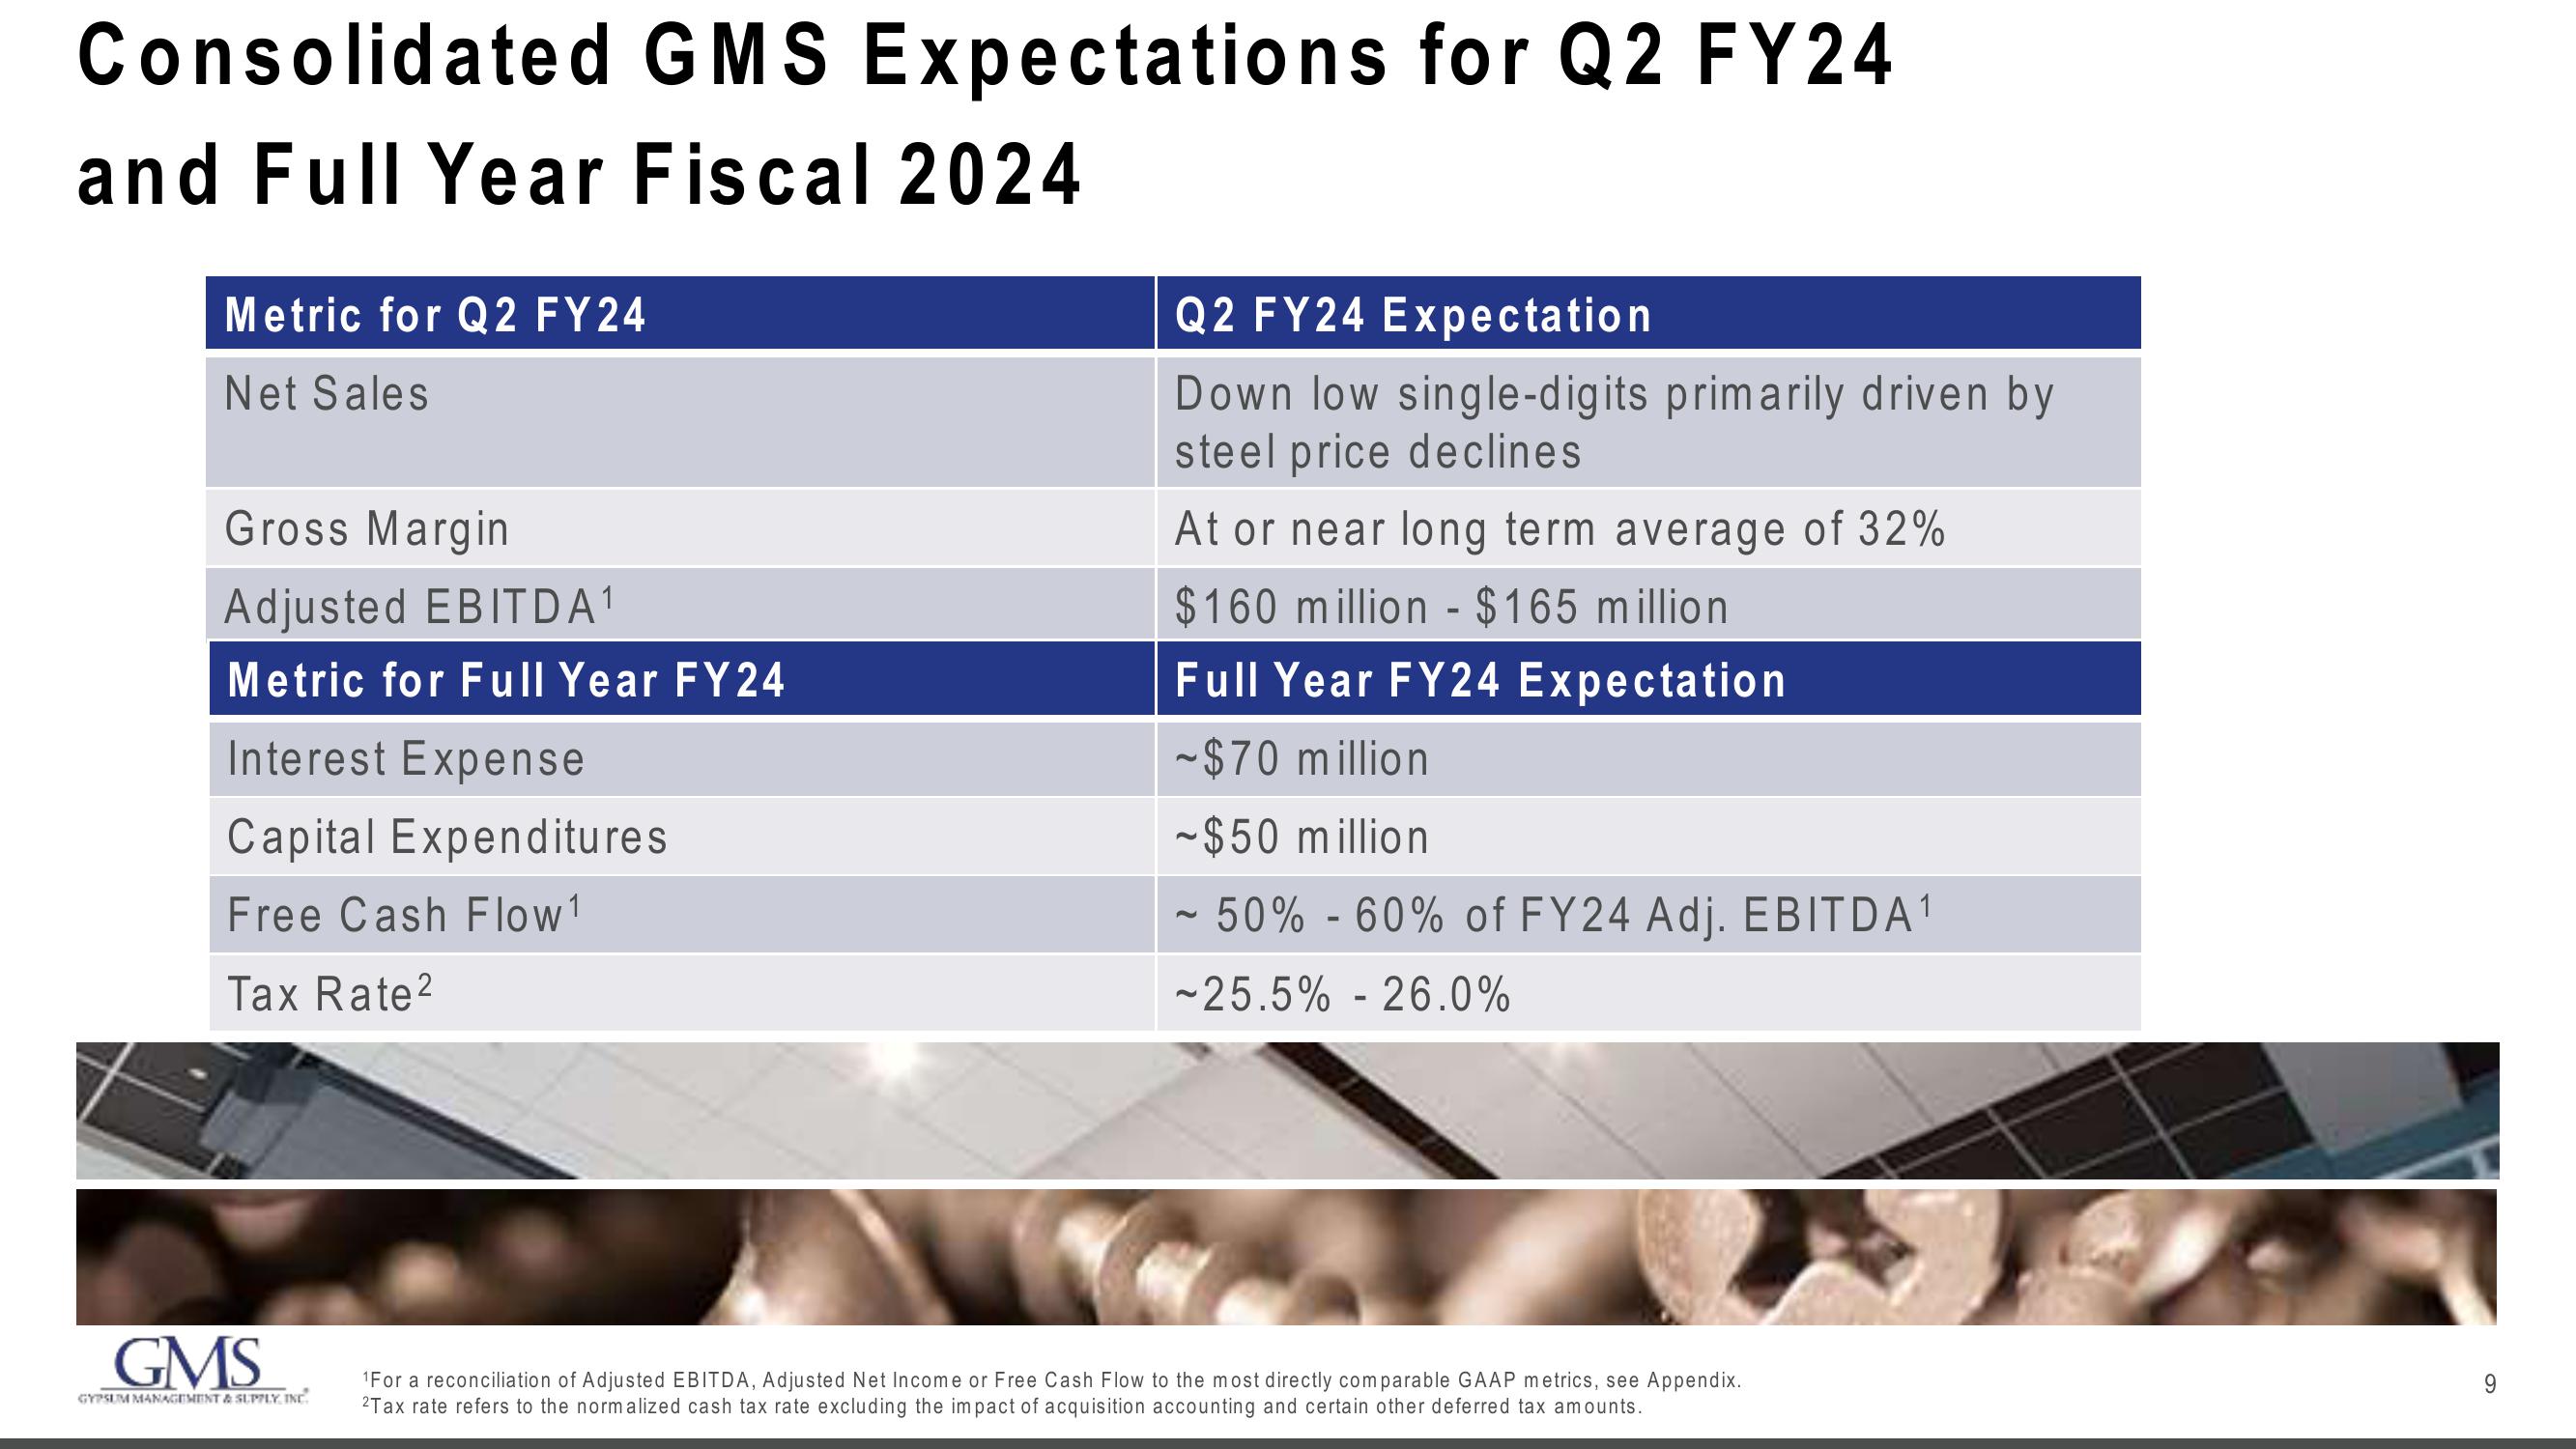
Consolidated GMS Expectations for Q2 FY24
and Full Year Fiscal 2024
Metric for Q2 FY24
Net Sales
Gross Margin
Adjusted EBITDA ¹
Metric for Full Year FY 24
Interest Expense
Capital Expenditures
Free Cash Flow ¹
Tax Rate²
GMS
GYPSUM MANAGEMENT & SUPPLY, INC.
Q2 FY24 Expectation
Down low single-digits primarily driven by
steel price declines
At or near long term average of 32%
$160 million - $165 million
Full Year FY24 Expectation
~$70 million
~$50 million
~ 50% - 60% of FY24 Adj. EBITDA¹
~25.5% -26.0%
¹For a reconciliation of Adjusted EBITDA, Adjusted Net Income or Free Cash Flow to the most directly comparable GAAP metrics, see Appendix.
2Tax rate refers to the normalized cash tax rate excluding the impact of acquisition accounting and certain other deferred tax amounts.
9View entire presentation