Nexters Results Presentation Deck
Key financial highlights (1/2)
$m
Revenue
128
Q3 2022
5
381
9M 2022
Source:
-5%
-7%
121
Q3 2023
355
9M 2023
Company information
$m
Profit for the period,
net of tax
32
Q3 2022
84
9M 2022
-25%
-58%
24
Q3 2023
35
9M 2023
$m
Total comprehensive
Income/ Loss
31
Q3 2022
87
9M 2022
-22%
-58%
24
Q3 2023
36
9M 2023
$m
Adjusted EBITDA
45
Q3 2022
100
9M 2022
-35%
-67%
29
Q3 2023
33
9M 2023
GDEU
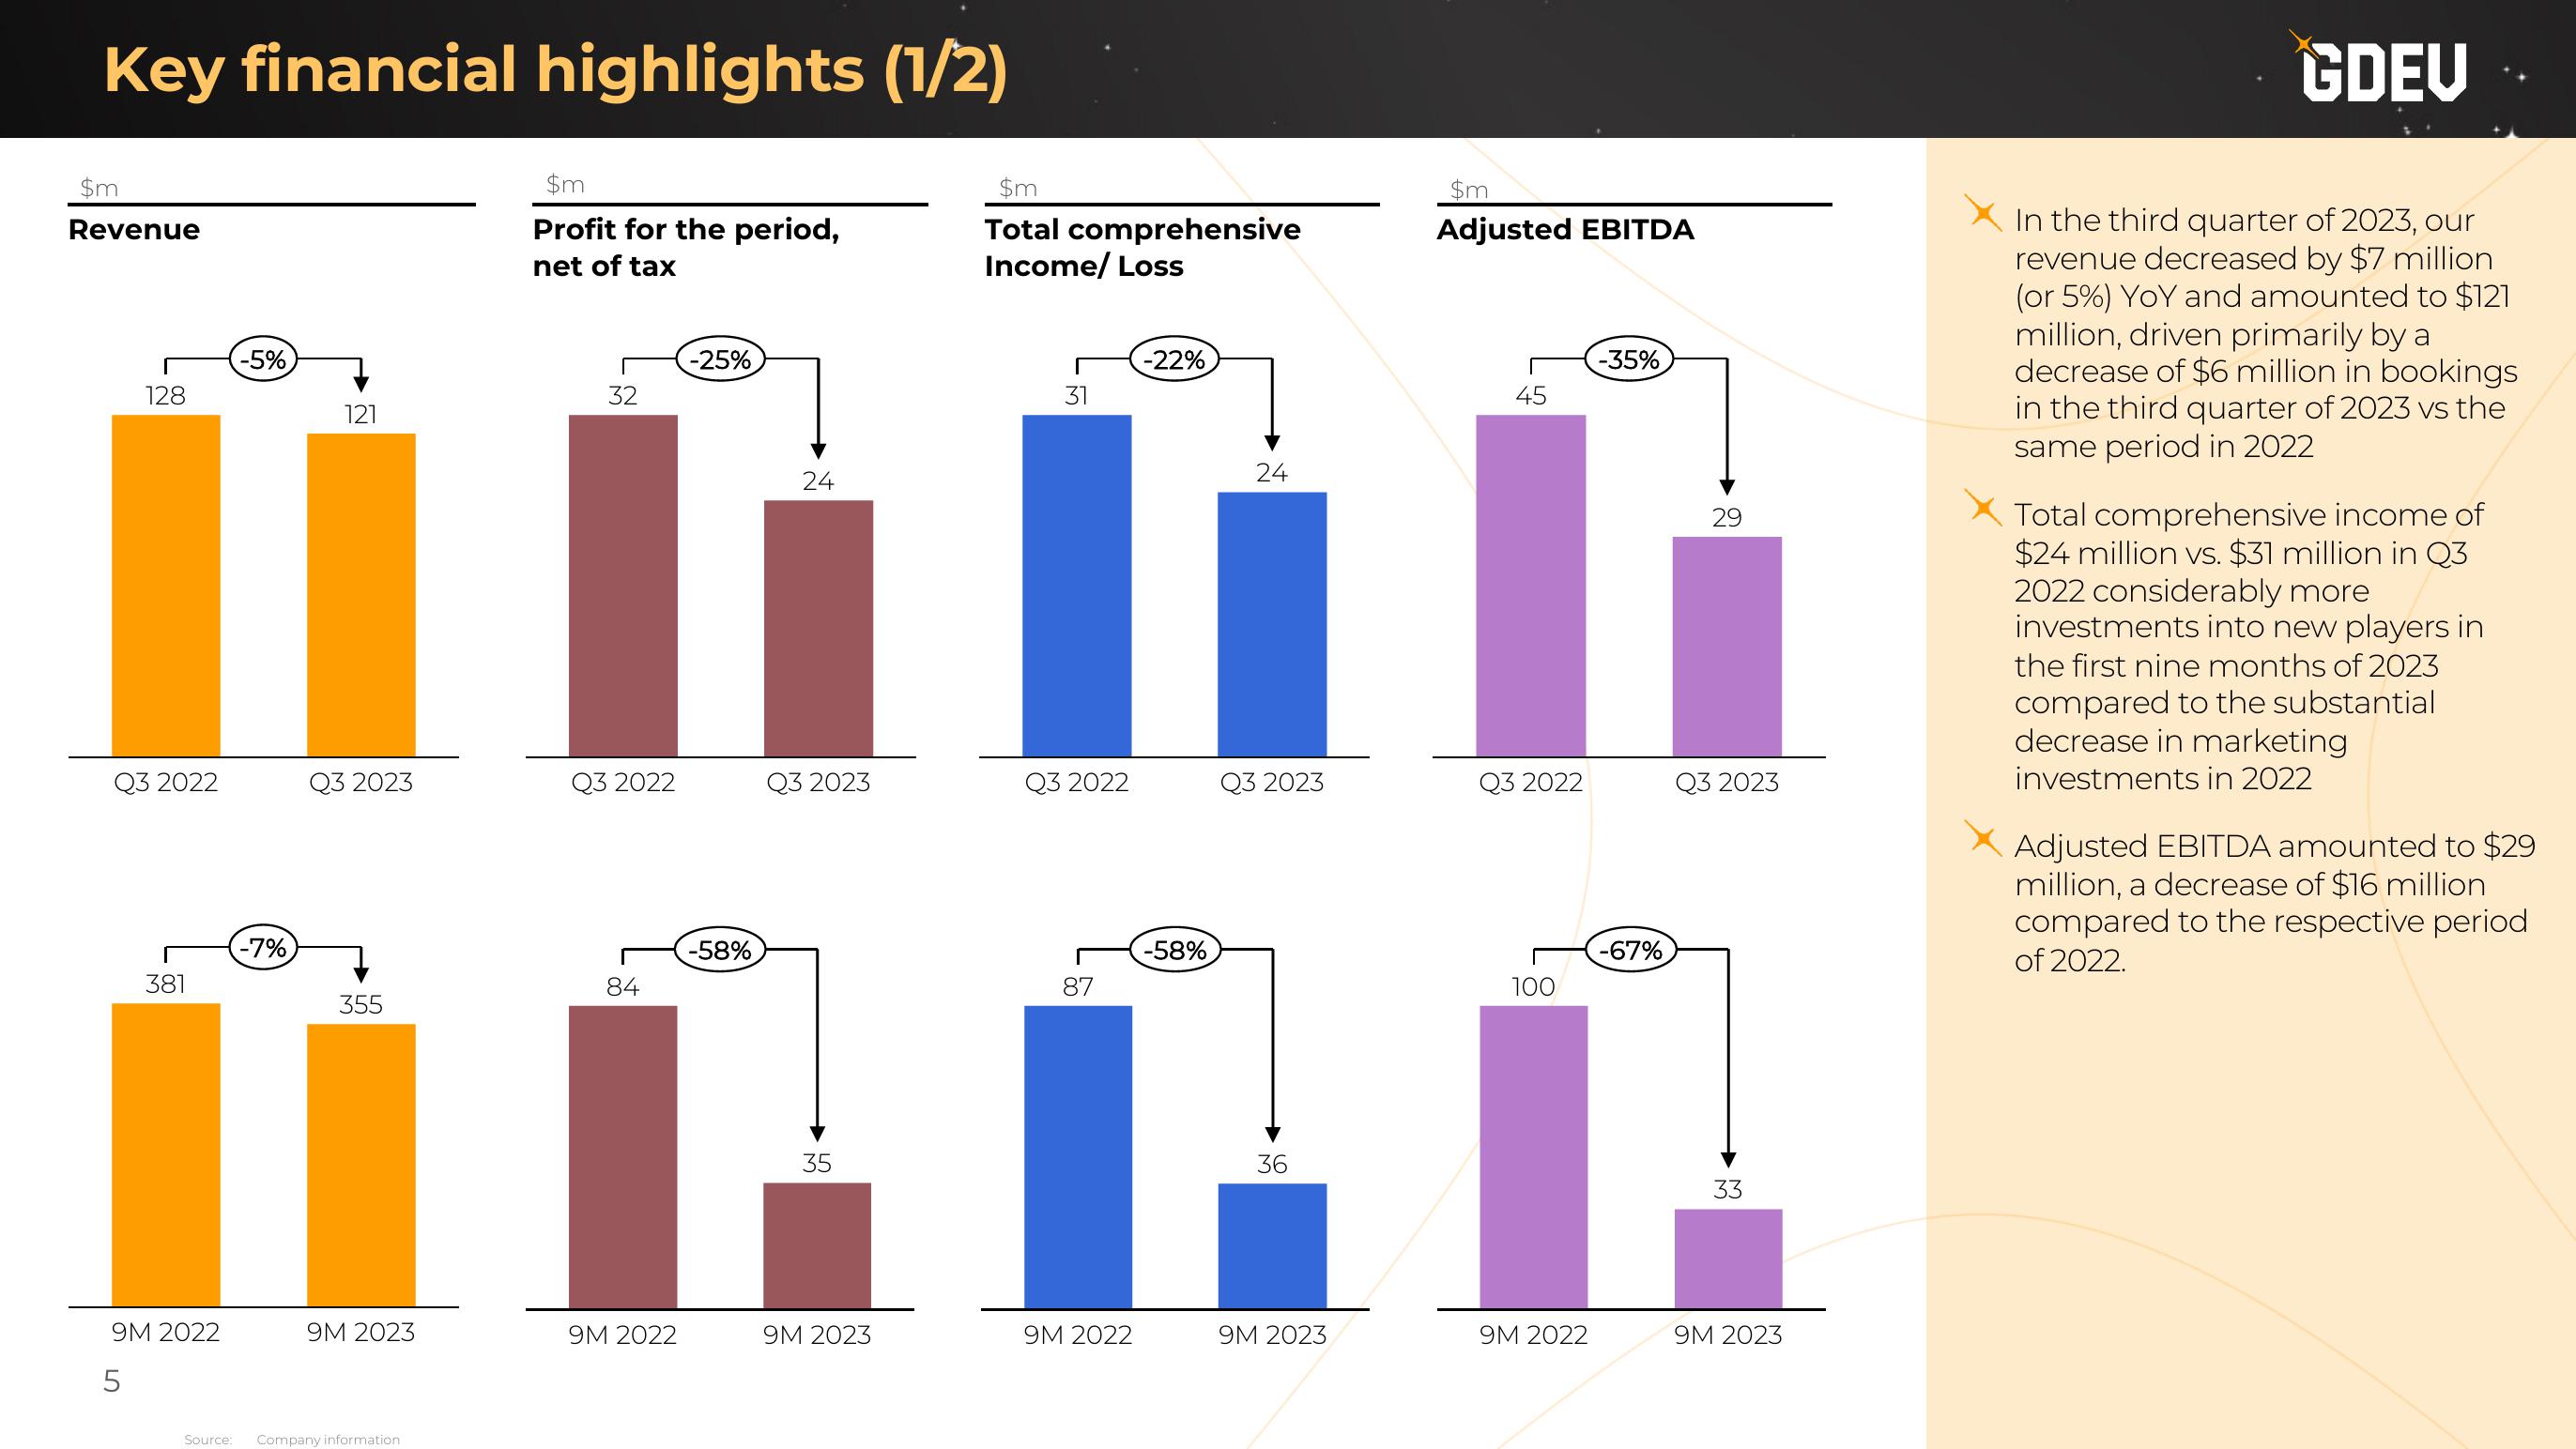
In the third quarter of 2023, our
revenue decreased by $7 million
(or 5%) YoY and amounted to $121
million, driven primarily by a
decrease of $6 million in bookings
in the third quarter of 2023 vs the
same period in 2022
Total comprehensive income of
$24 million vs. $31 million in Q3
2022 considerably more
investments into new players in
the first nine months of 2023
compared to the substantial
decrease in marketing
investments in 2022
Adjusted EBITDA amounted to $29
million, a decrease of $16 million
compared to the respective period
of 2022.View entire presentation