Prada Results Presentation Deck
€m
Net Revenues
COGS
Gross Margin
Selling
Advertising & Promotion
Design and Product Development
G&A
Operating expenses
EBIT
Total Financial expenses
EBT
Income Taxes
Minority Income
Group Net income / (Loss)
Total D&A
EBITDA
PRADA Group
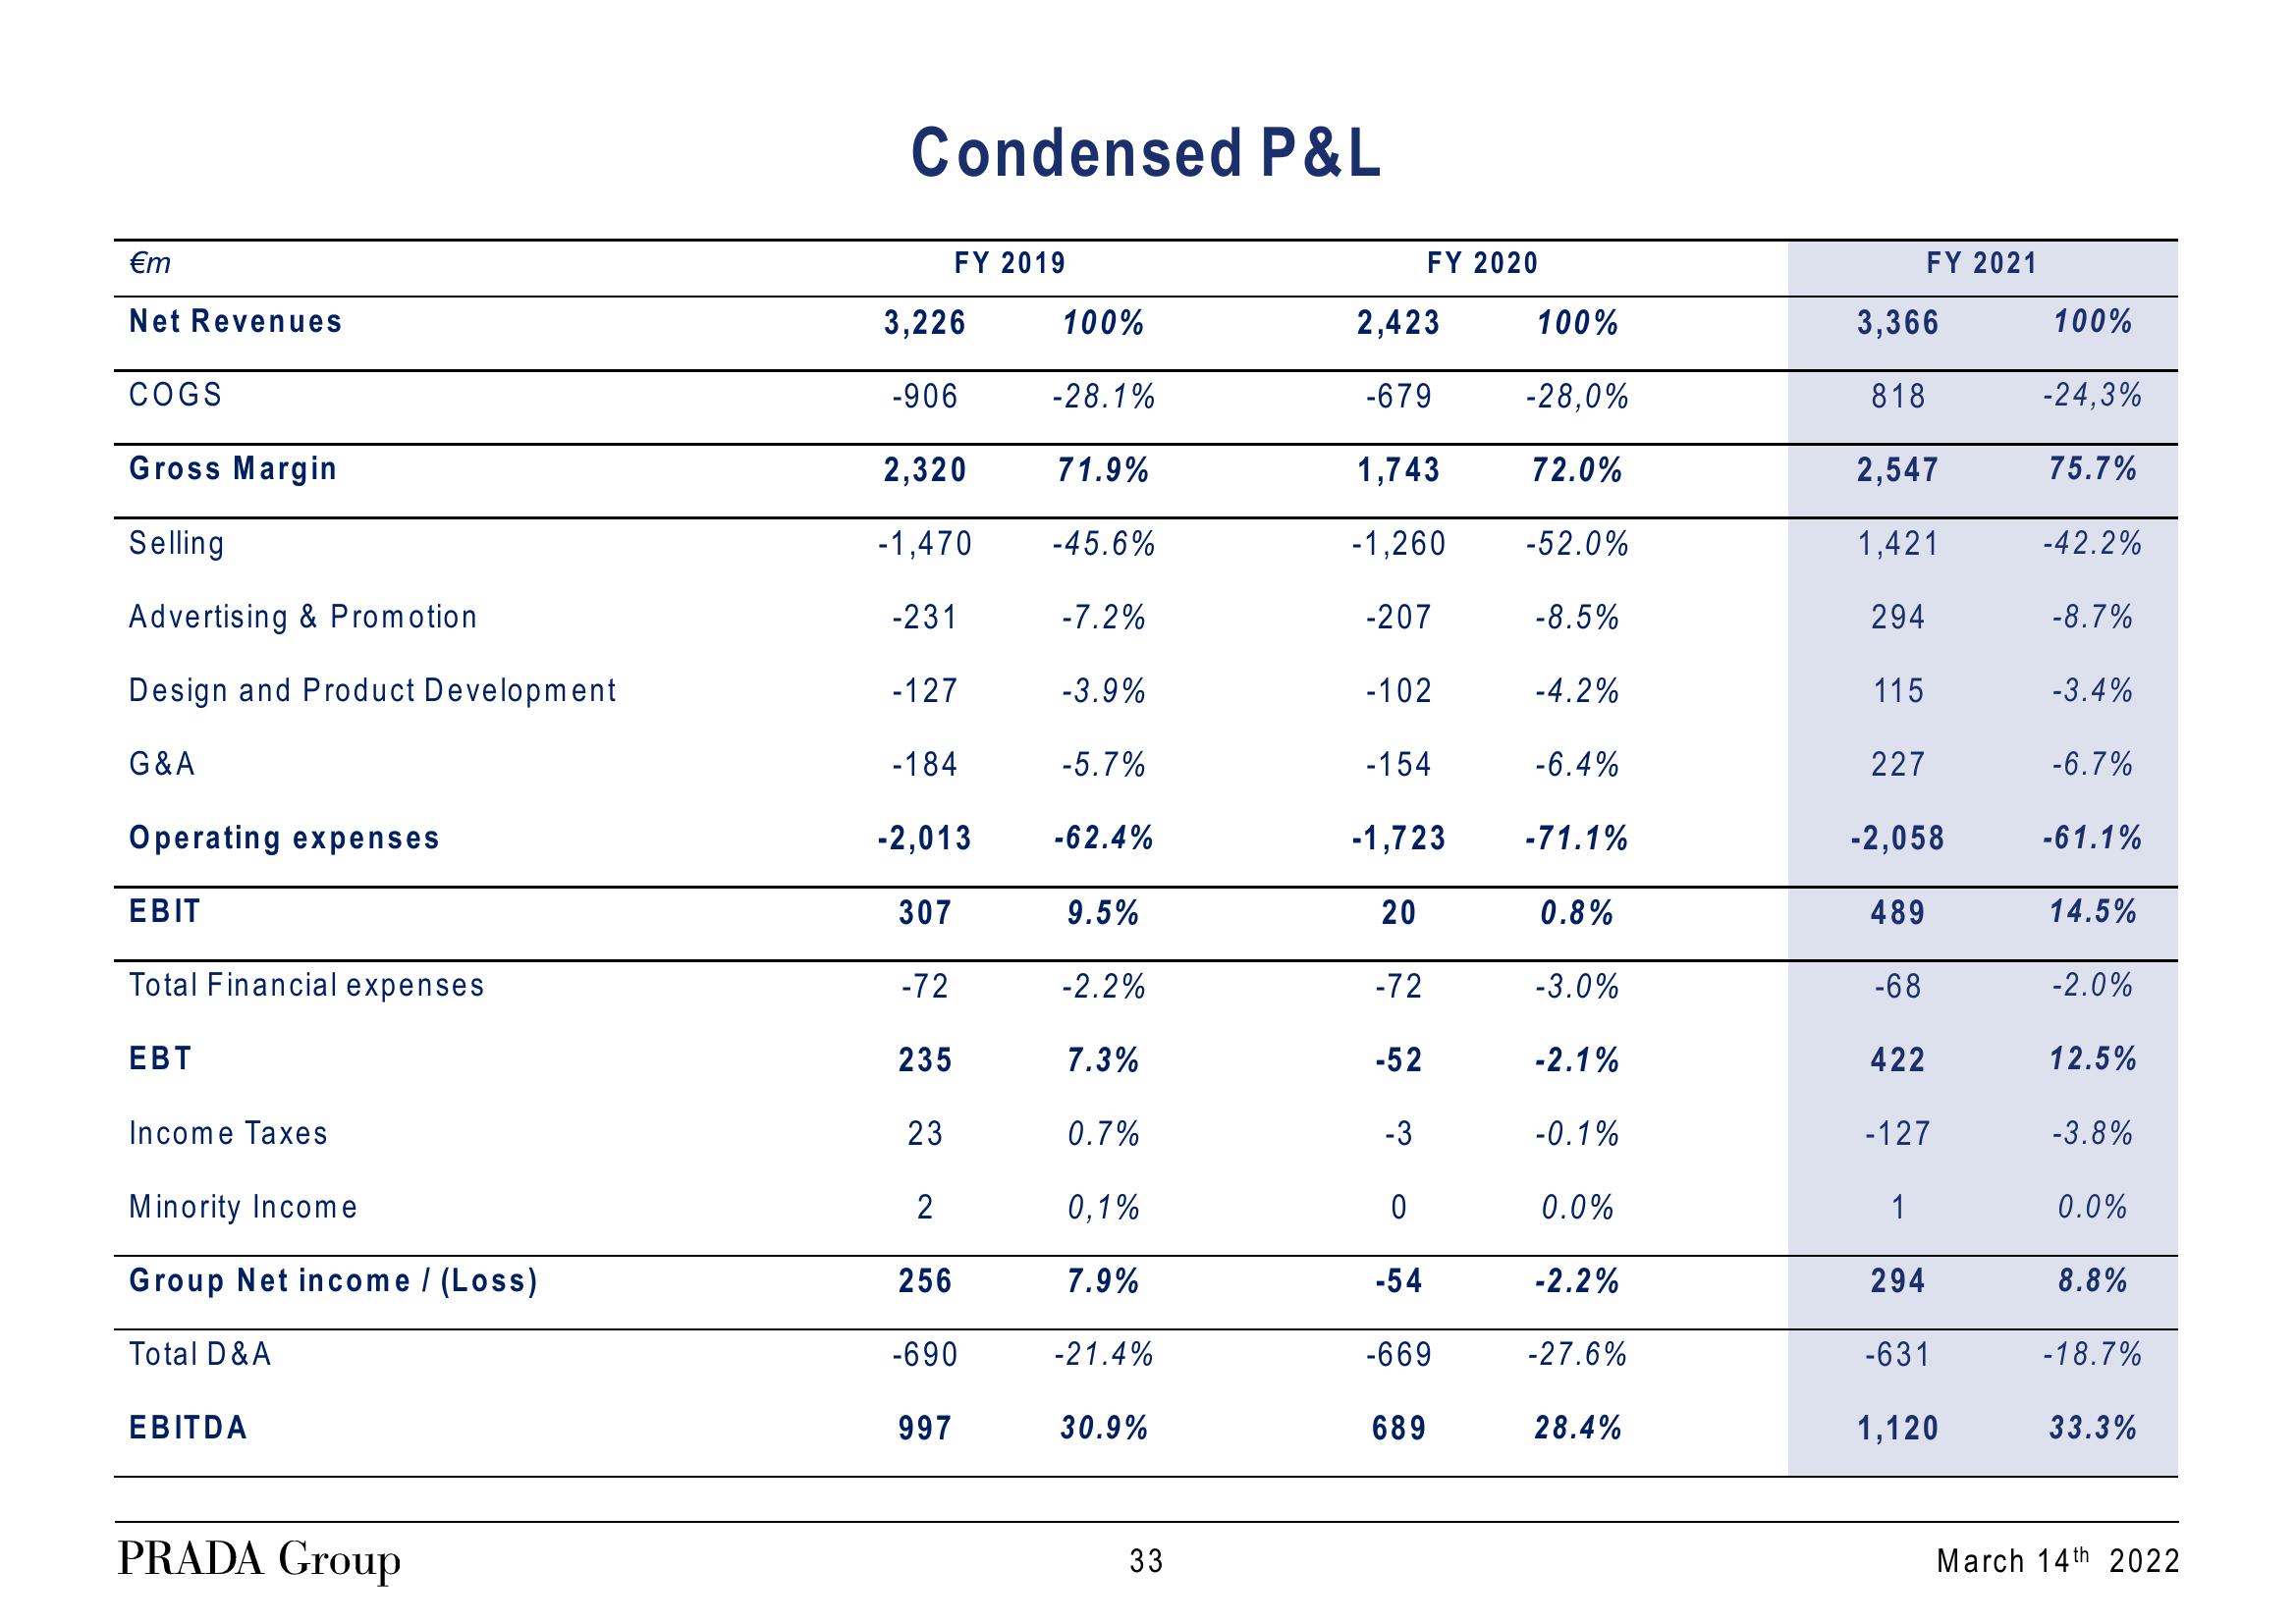
Condensed P&L
3,226
-906
2,320
-1,470
-231
-127
-184
-2,013
307
-72
FY 2019
235
23
2
256
-690
997
100%
-28.1%
71.9%
-45.6%
-7.2%
-3.9%
-5.7%
-62.4%
9.5%
-2.2%
7.3%
0.7%
0,1%
7.9%
-21.4%
30.9%
33
2,423
-679
1,743
-1,260
-207
-102
FY 2020
-154
-1,723
20
-72
-52
-3
0
-54
-669
689
100%
-28,0%
72.0%
-52.0%
-8.5%
-4.2%
-6.4%
-71.1%
0.8%
-3.0%
-2.1%
-0.1%
0.0%
-2.2%
-27.6%
28.4%
3,366
818
2,547
1,421
294
115
227
-2,058
489
-68
FY 2021
422
-127
1
294
-631
1,120
100%
-24,3%
75.7%
-42.2%
-8.7%
-3.4%
-6.7%
-61.1%
14.5%
-2.0%
12.5%
-3.8%
0.0%
8.8%
-18.7%
33.3%
March 14th 2022View entire presentation