Q1 2018 Earnings Presentation
NON-GAAP FINANCIAL PERFORMANCE:
Q1 2018 Overview
[$ m, except EPS]
Revenues
Operating Profit
Margin (%)
Non-GAAP EPS
Free Cash Flow
[$ m]
Net (Debt)/ Cash
Working capital (WC)*
WC-to-revenue ratio
* WC
Q1 2018
431.7
52.9
12.3%
$0.24
35.3
Mar 31, 2018
63.3
726.9
$0.40
Q1 2017
384.9
(Accounts Receivable + Inventory - Accounts Payable)
49.2
12.8%
$0.19
21.1
Mar 31, 2017
79.7
607.1
$0.37
+12.2%
+8%
-50 bps
+26%
+14.2M
A
-21%
+20%
+8%
■
■
M
BRUKER
COMMENTS
-
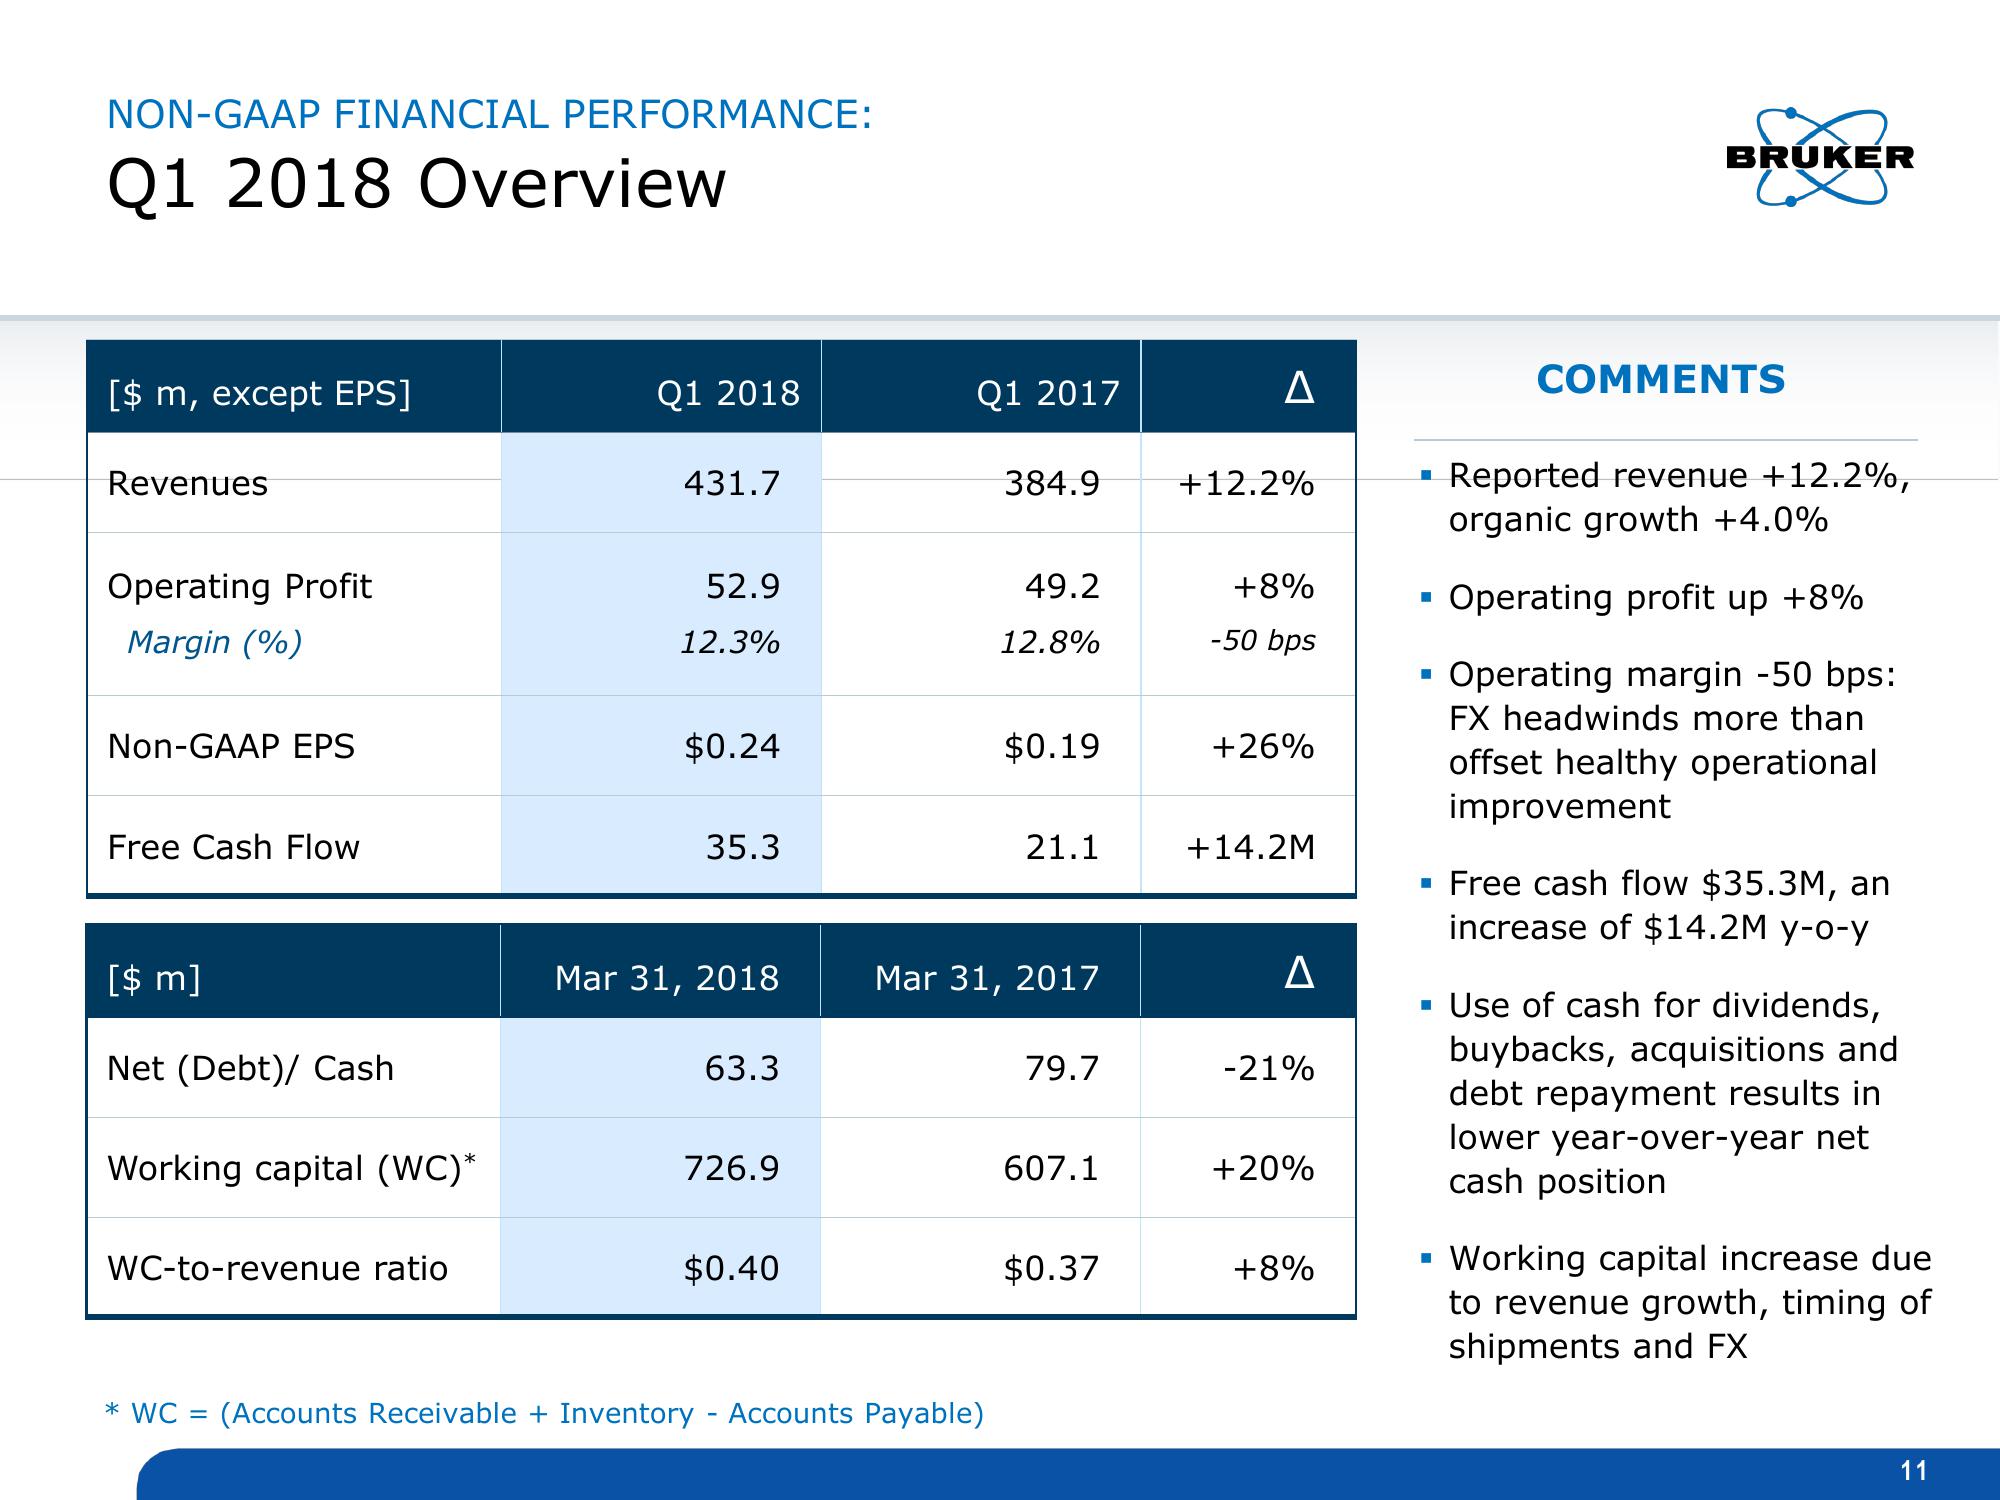
Reported revenue +12.2%,
organic growth +4.0%
Operating profit up +8%
Operating margin -50 bps:
FX headwinds more than
offset healthy operational
improvement
▪ Free cash flow $35.3M, an
increase of $14.2M y-o-y
▪ Use of cash for dividends,
buybacks, acquisitions and
debt repayment results in
lower year-over-year net
cash position
Working capital increase due
to revenue growth, timing of
shipments and FX
11View entire presentation