Q4 & FY 2018 Financial Results
Q4 Consolidated Results
($ in million)
Performance
Transportation
Net Sales
Net Income (loss)
$1,165
Financial Performance
(1)
PROPRIETARY
2018
(2.1)%
758
401
1,158
75
Q4
4.4%
Q4 2017 Volume Price
2017
(62)
Adjusted EBITDA
235
245
(1) Represents Net Income (loss) attributable to controlling interests
732
433
1,165
Net Sales Variance
(3.3)%
FX
% Change
Incl. FX
3.4 %
(7.4)%
(0.6)%
(4.3)%
0.4%
Excl. FX
6.4 %
(3.7)%
2.7%
(0.6)%
$1,158
Acq. Q4 2018
5
Commentary
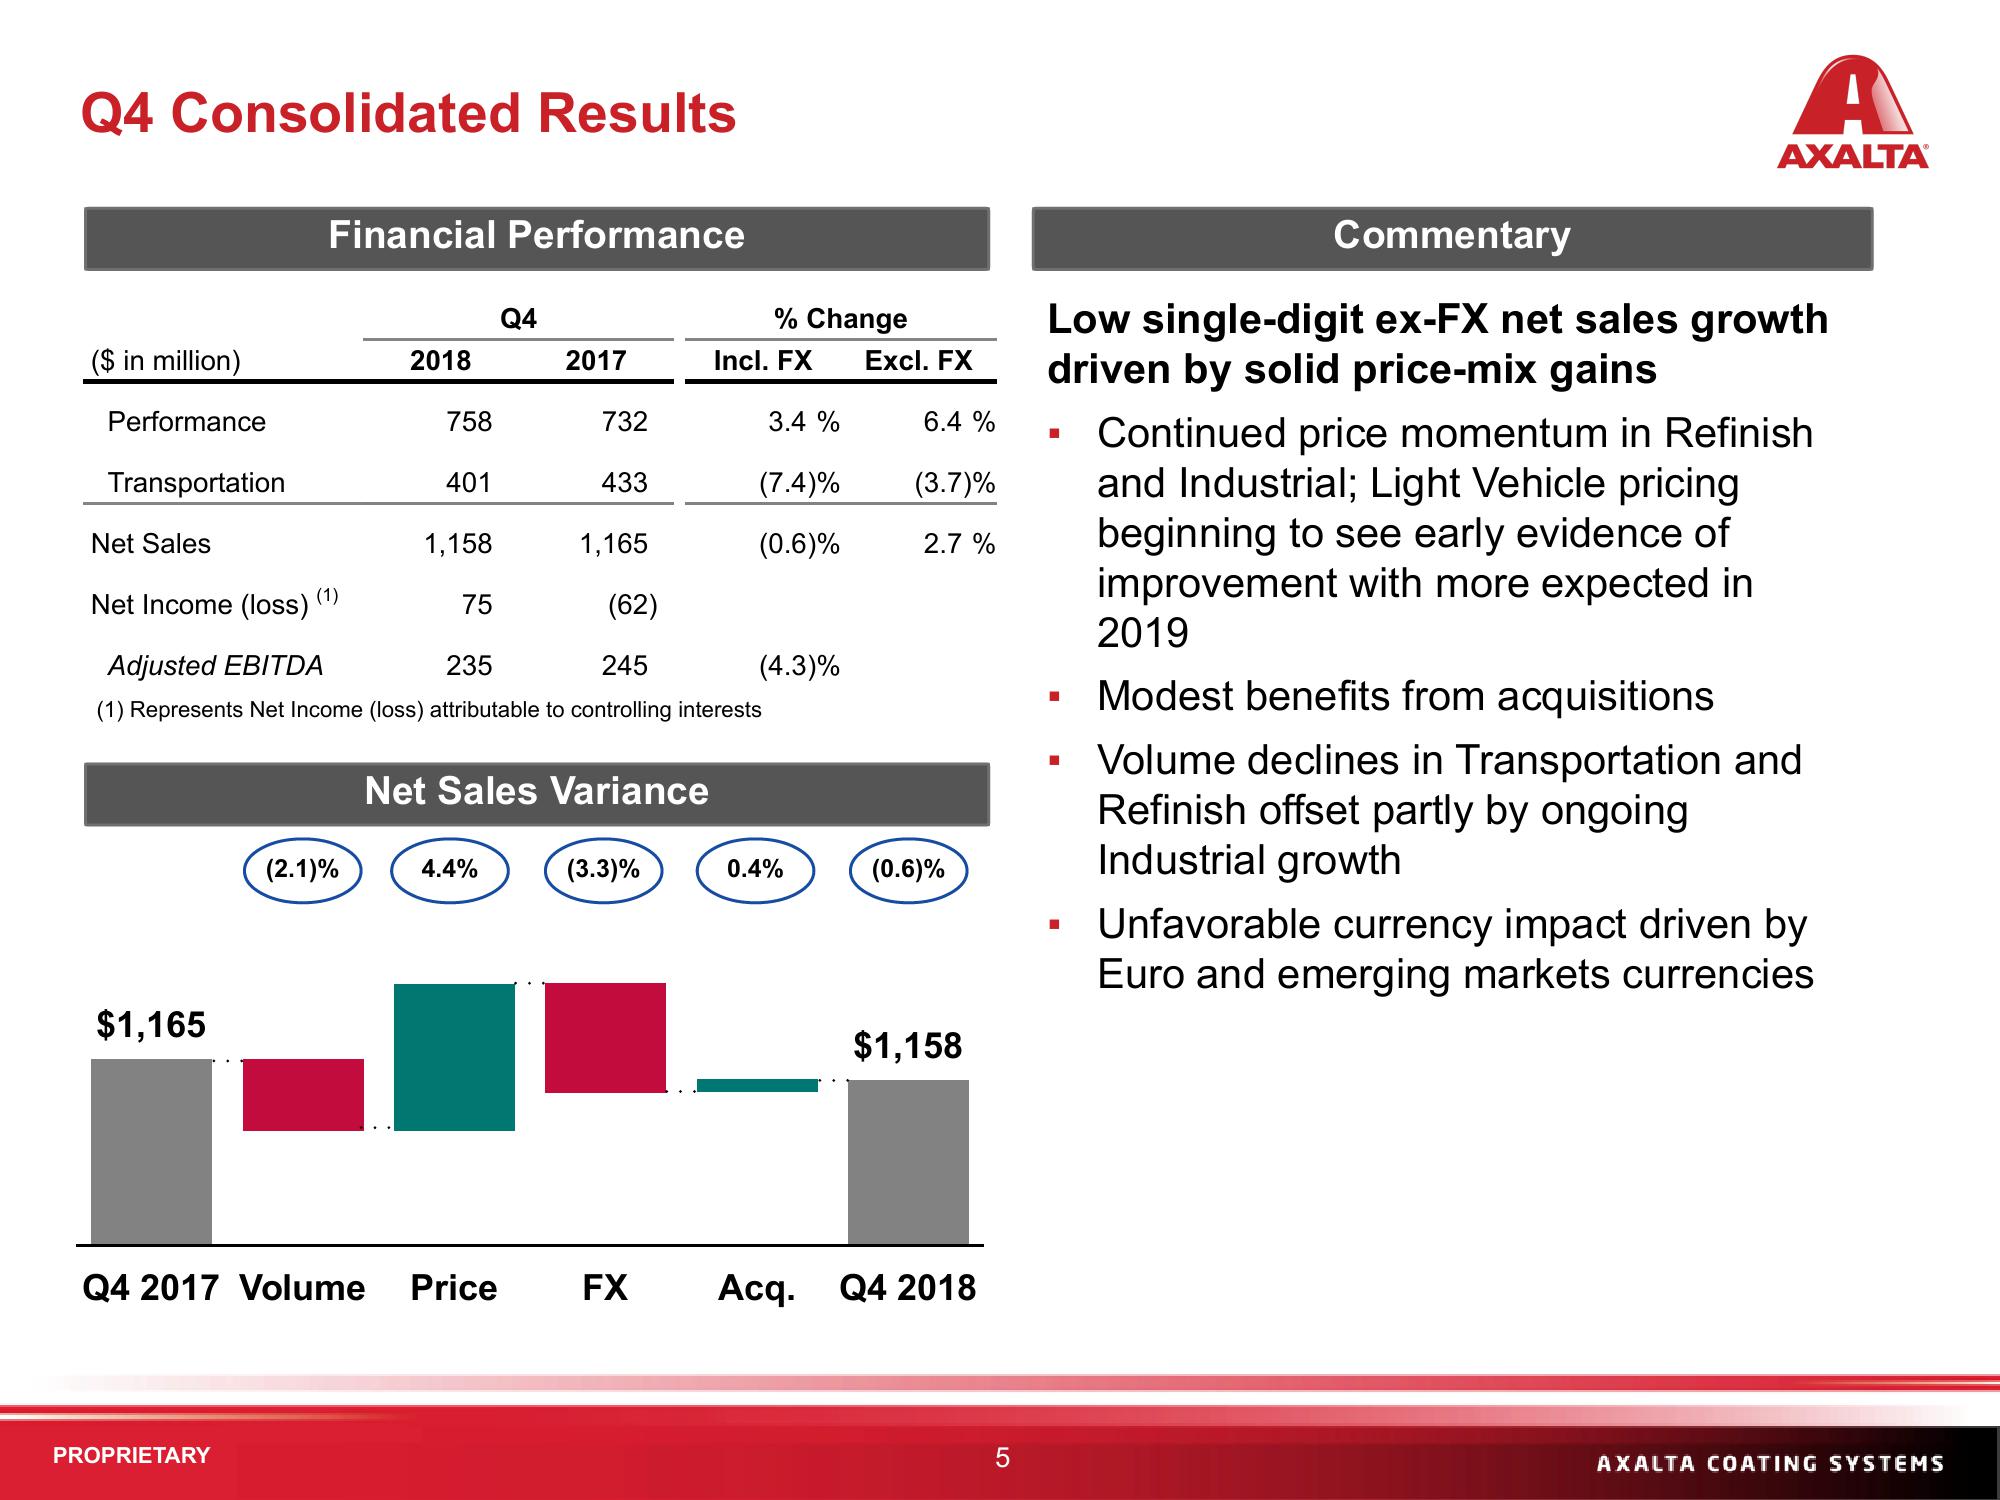
Low single-digit ex-FX net sales growth
driven by solid price-mix gains
Continued price momentum in Refinish
and Industrial; Light Vehicle pricing
beginning to see early evidence of
improvement with more expected in
2019
■
■
A
AXALTAⓇ
■
Modest benefits from acquisitions
Volume declines in Transportation and
Refinish offset partly by ongoing
Industrial growth
Unfavorable currency impact driven by
Euro and emerging markets currencies
AXALTA COATING SYSTEMSView entire presentation