Wix Results Presentation Deck slide image

Wix Results Presentation Deck

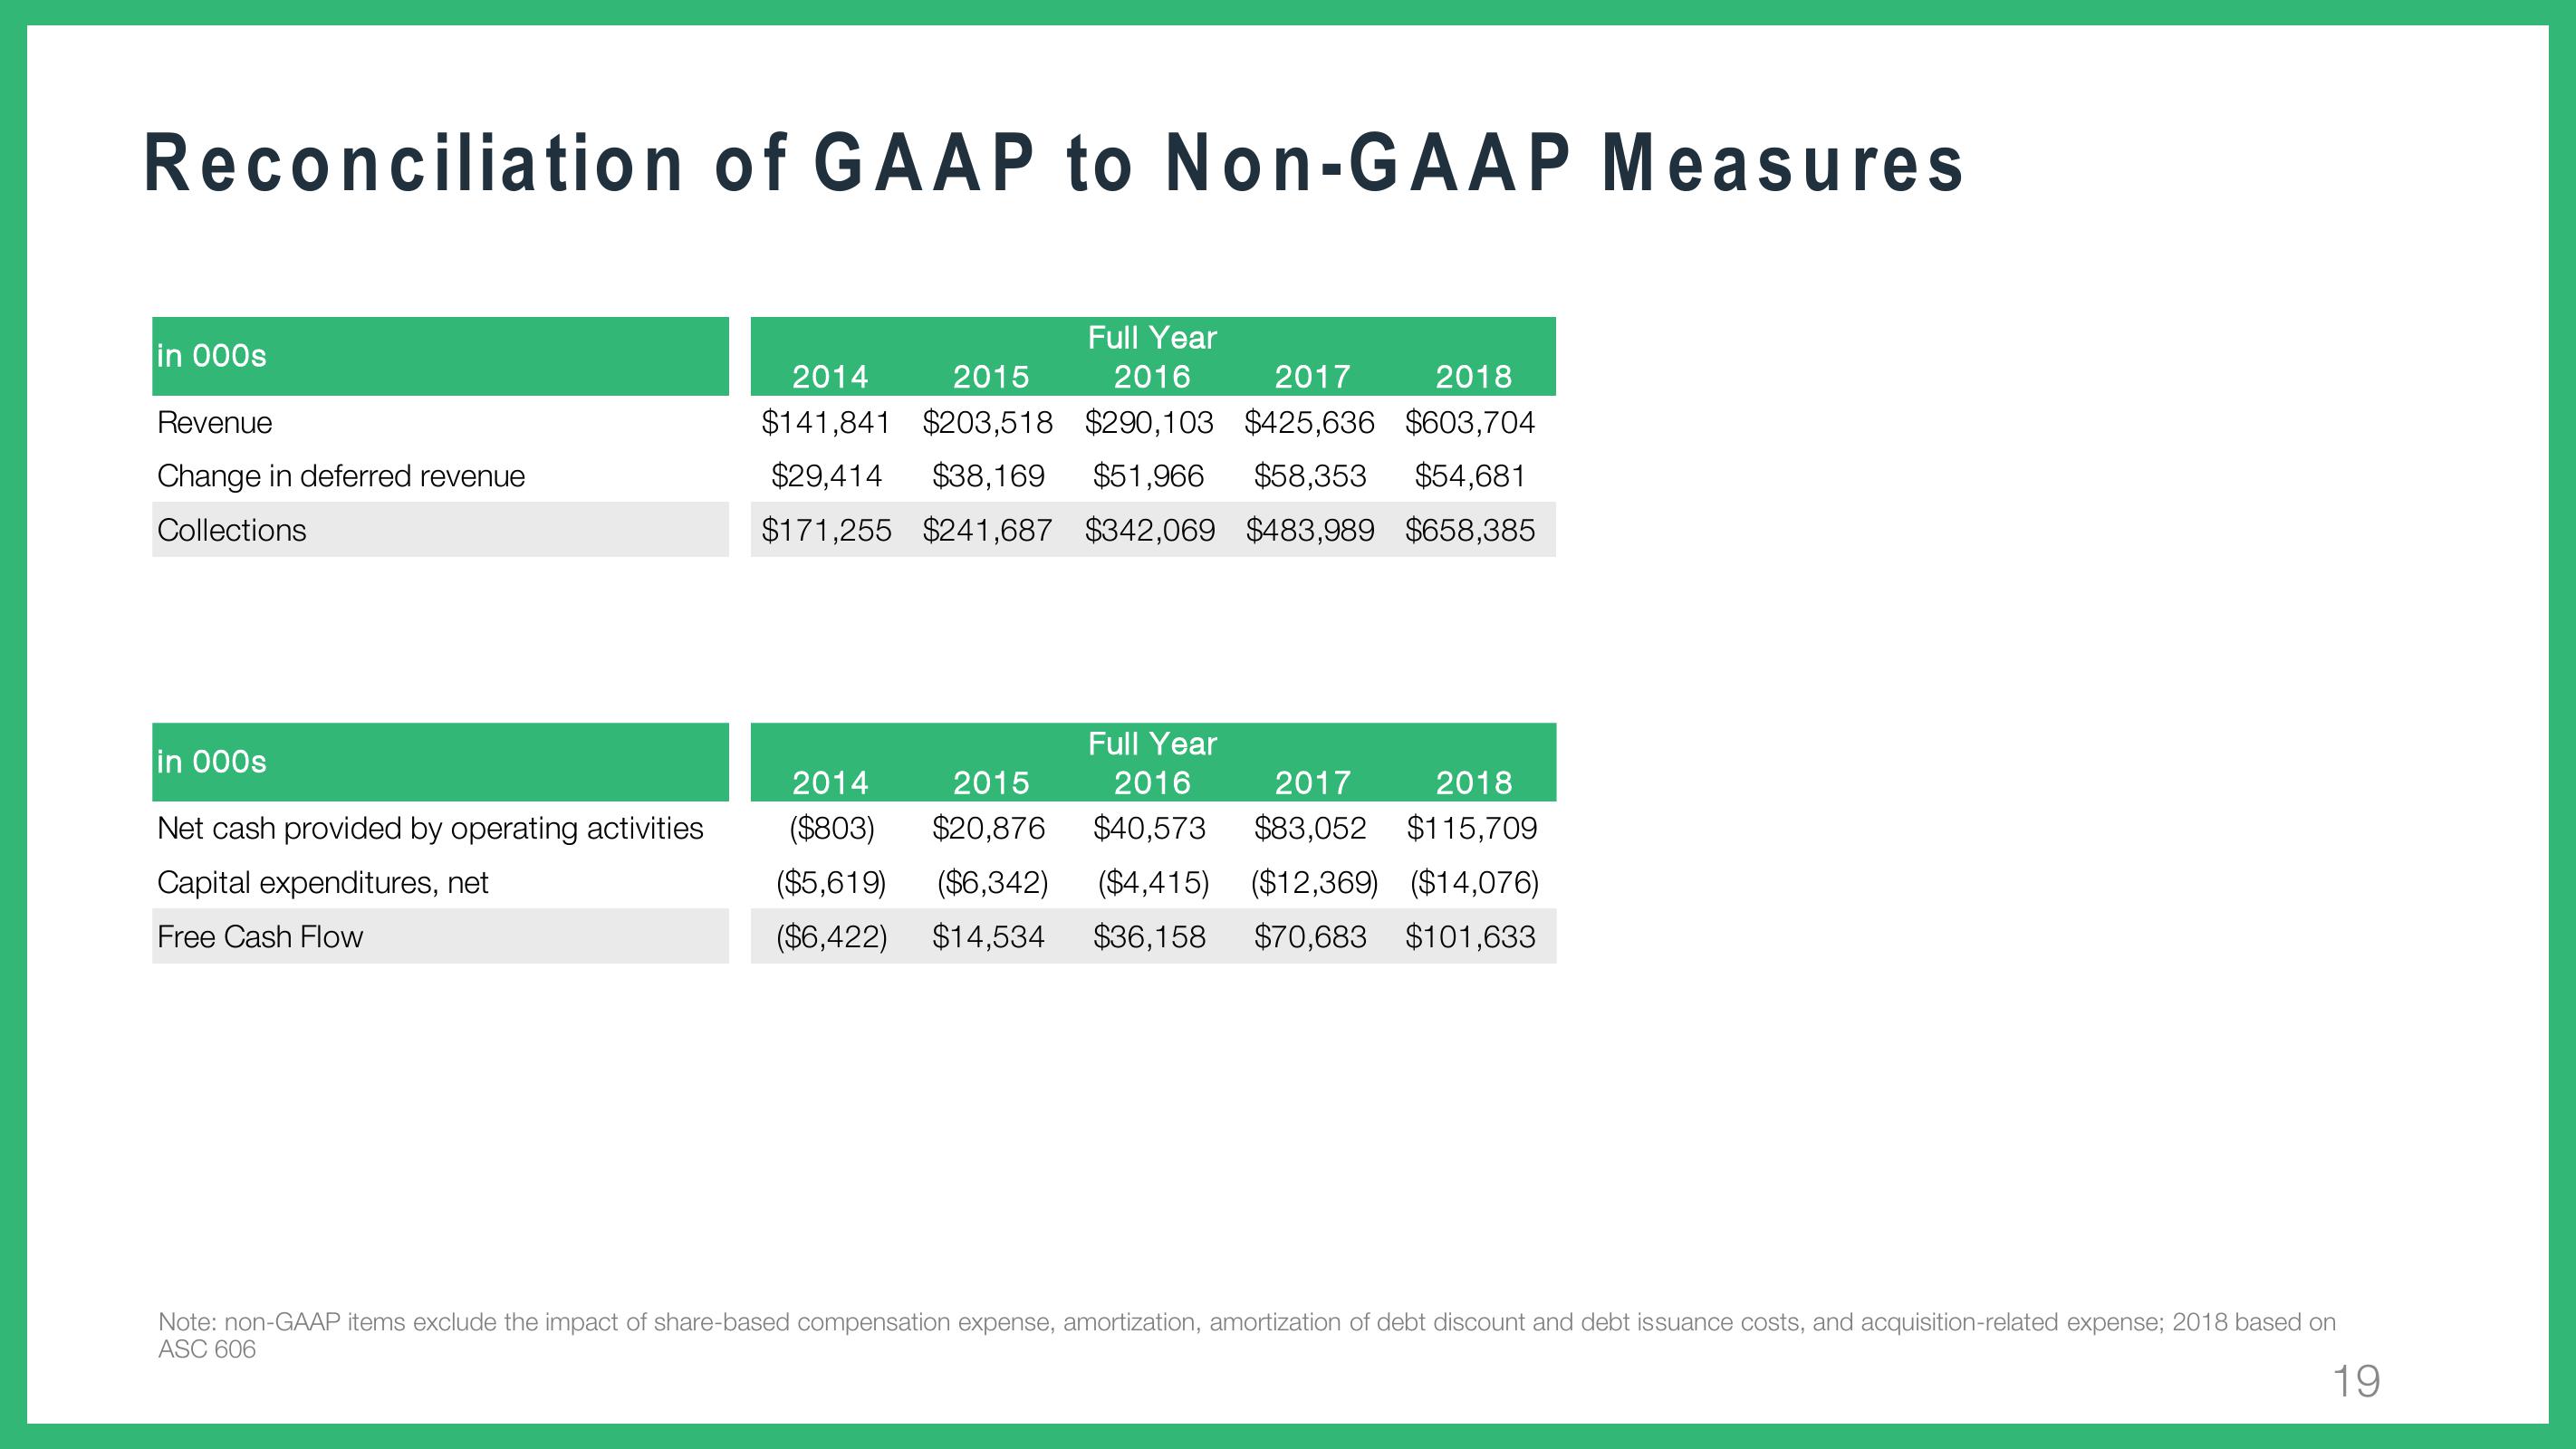
Reconciliation of GAAP to Non-GAAP Measures in 000s Revenue Change in deferred revenue Collections in 000s Net cash provided by operating activities Capital expenditures, net Free Cash Flow Full Year 2016 2014 2015 2017 2018 $141,841 $203,518 $290,103 $425,636 $603,704 $29,414 $38,169 $51,966 $58,353 $54,681 $171,255 $241,687 $342,069 $483,989 $658,385 Full Year 2014 2015 2016 2017 2018 ($803) $20,876 $40,573 $83,052 $115,709 ($5,619) ($6,342) ($4,415) ($12,369) ($14,076) ($6,422) $14,534 $36,158 $70,683 $101,633 Note: non-GAAP items exclude the impact of share-based compensation expense, amortization, amortization of debt discount and debt issuance costs, and acquisition-related expense; 2018 based on ASC 606 19
View entire presentation