Tuya Results Presentation Deck
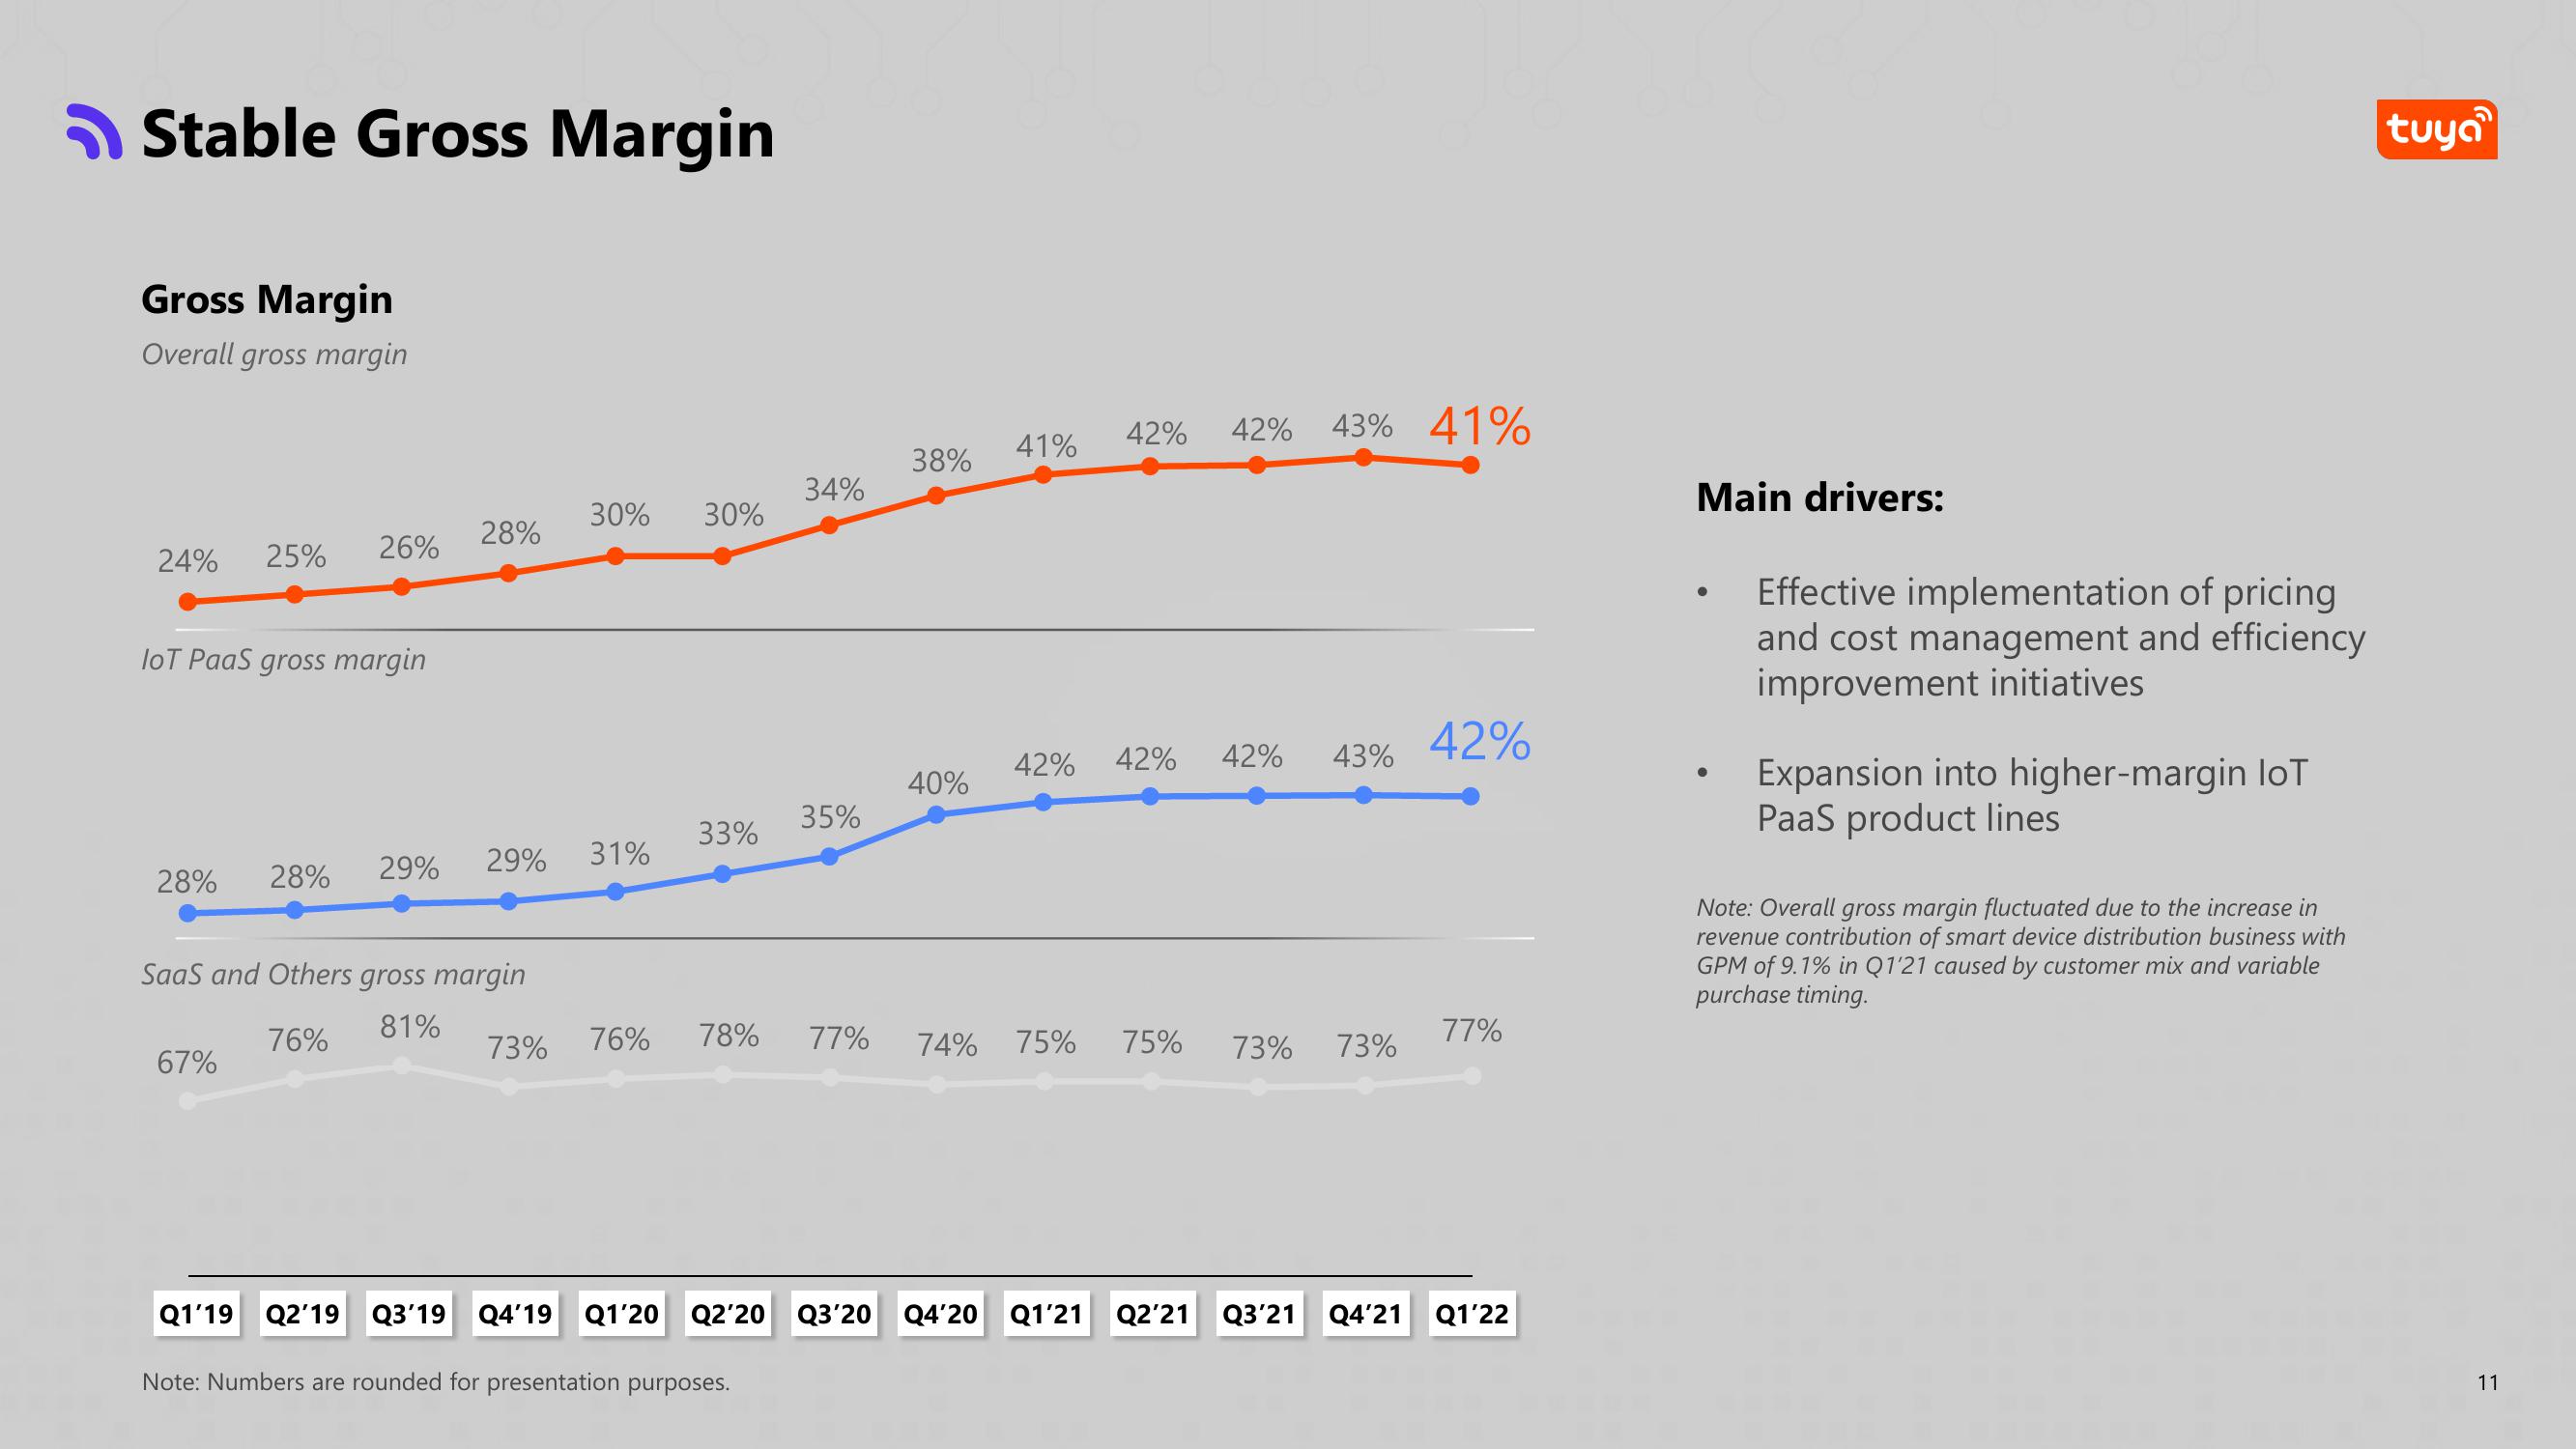
Stable Gross Margin
Gross Margin
Overall gross margin
24% 25% 26%
lot PaaS gross margin
28% 28%
29%
67%
28%
SaaS and Others gross margin
81%
76%
29% 31%
30% 30%
73%
33%
76% 78%
34%
35%
77%
38%
40%
41%
42% 42% 43% 41%
42% 42% 42% 43%
74% 75% 75% 73% 73%
42%
77%
Q1'19 Q2'19 Q3'19 Q4'19 Q1'20 Q2'20 Q3'20 Q4'20 Q1'21 Q2'21 Q3'21 Q4'21 Q1'22
Note: Numbers are rounded for presentation purposes.
Main drivers:
Effective implementation of pricing
and cost management and efficiency
improvement initiatives
Expansion into higher-margin loT
PaaS product lines
Note: Overall gross margin fluctuated due to the increase in
revenue contribution of smart device distribution business with
GPM of 9.1% in Q1'21 caused by customer mix and variable
purchase timing.
tuya
11View entire presentation