Commercial Metals Company Results Presentation Deck
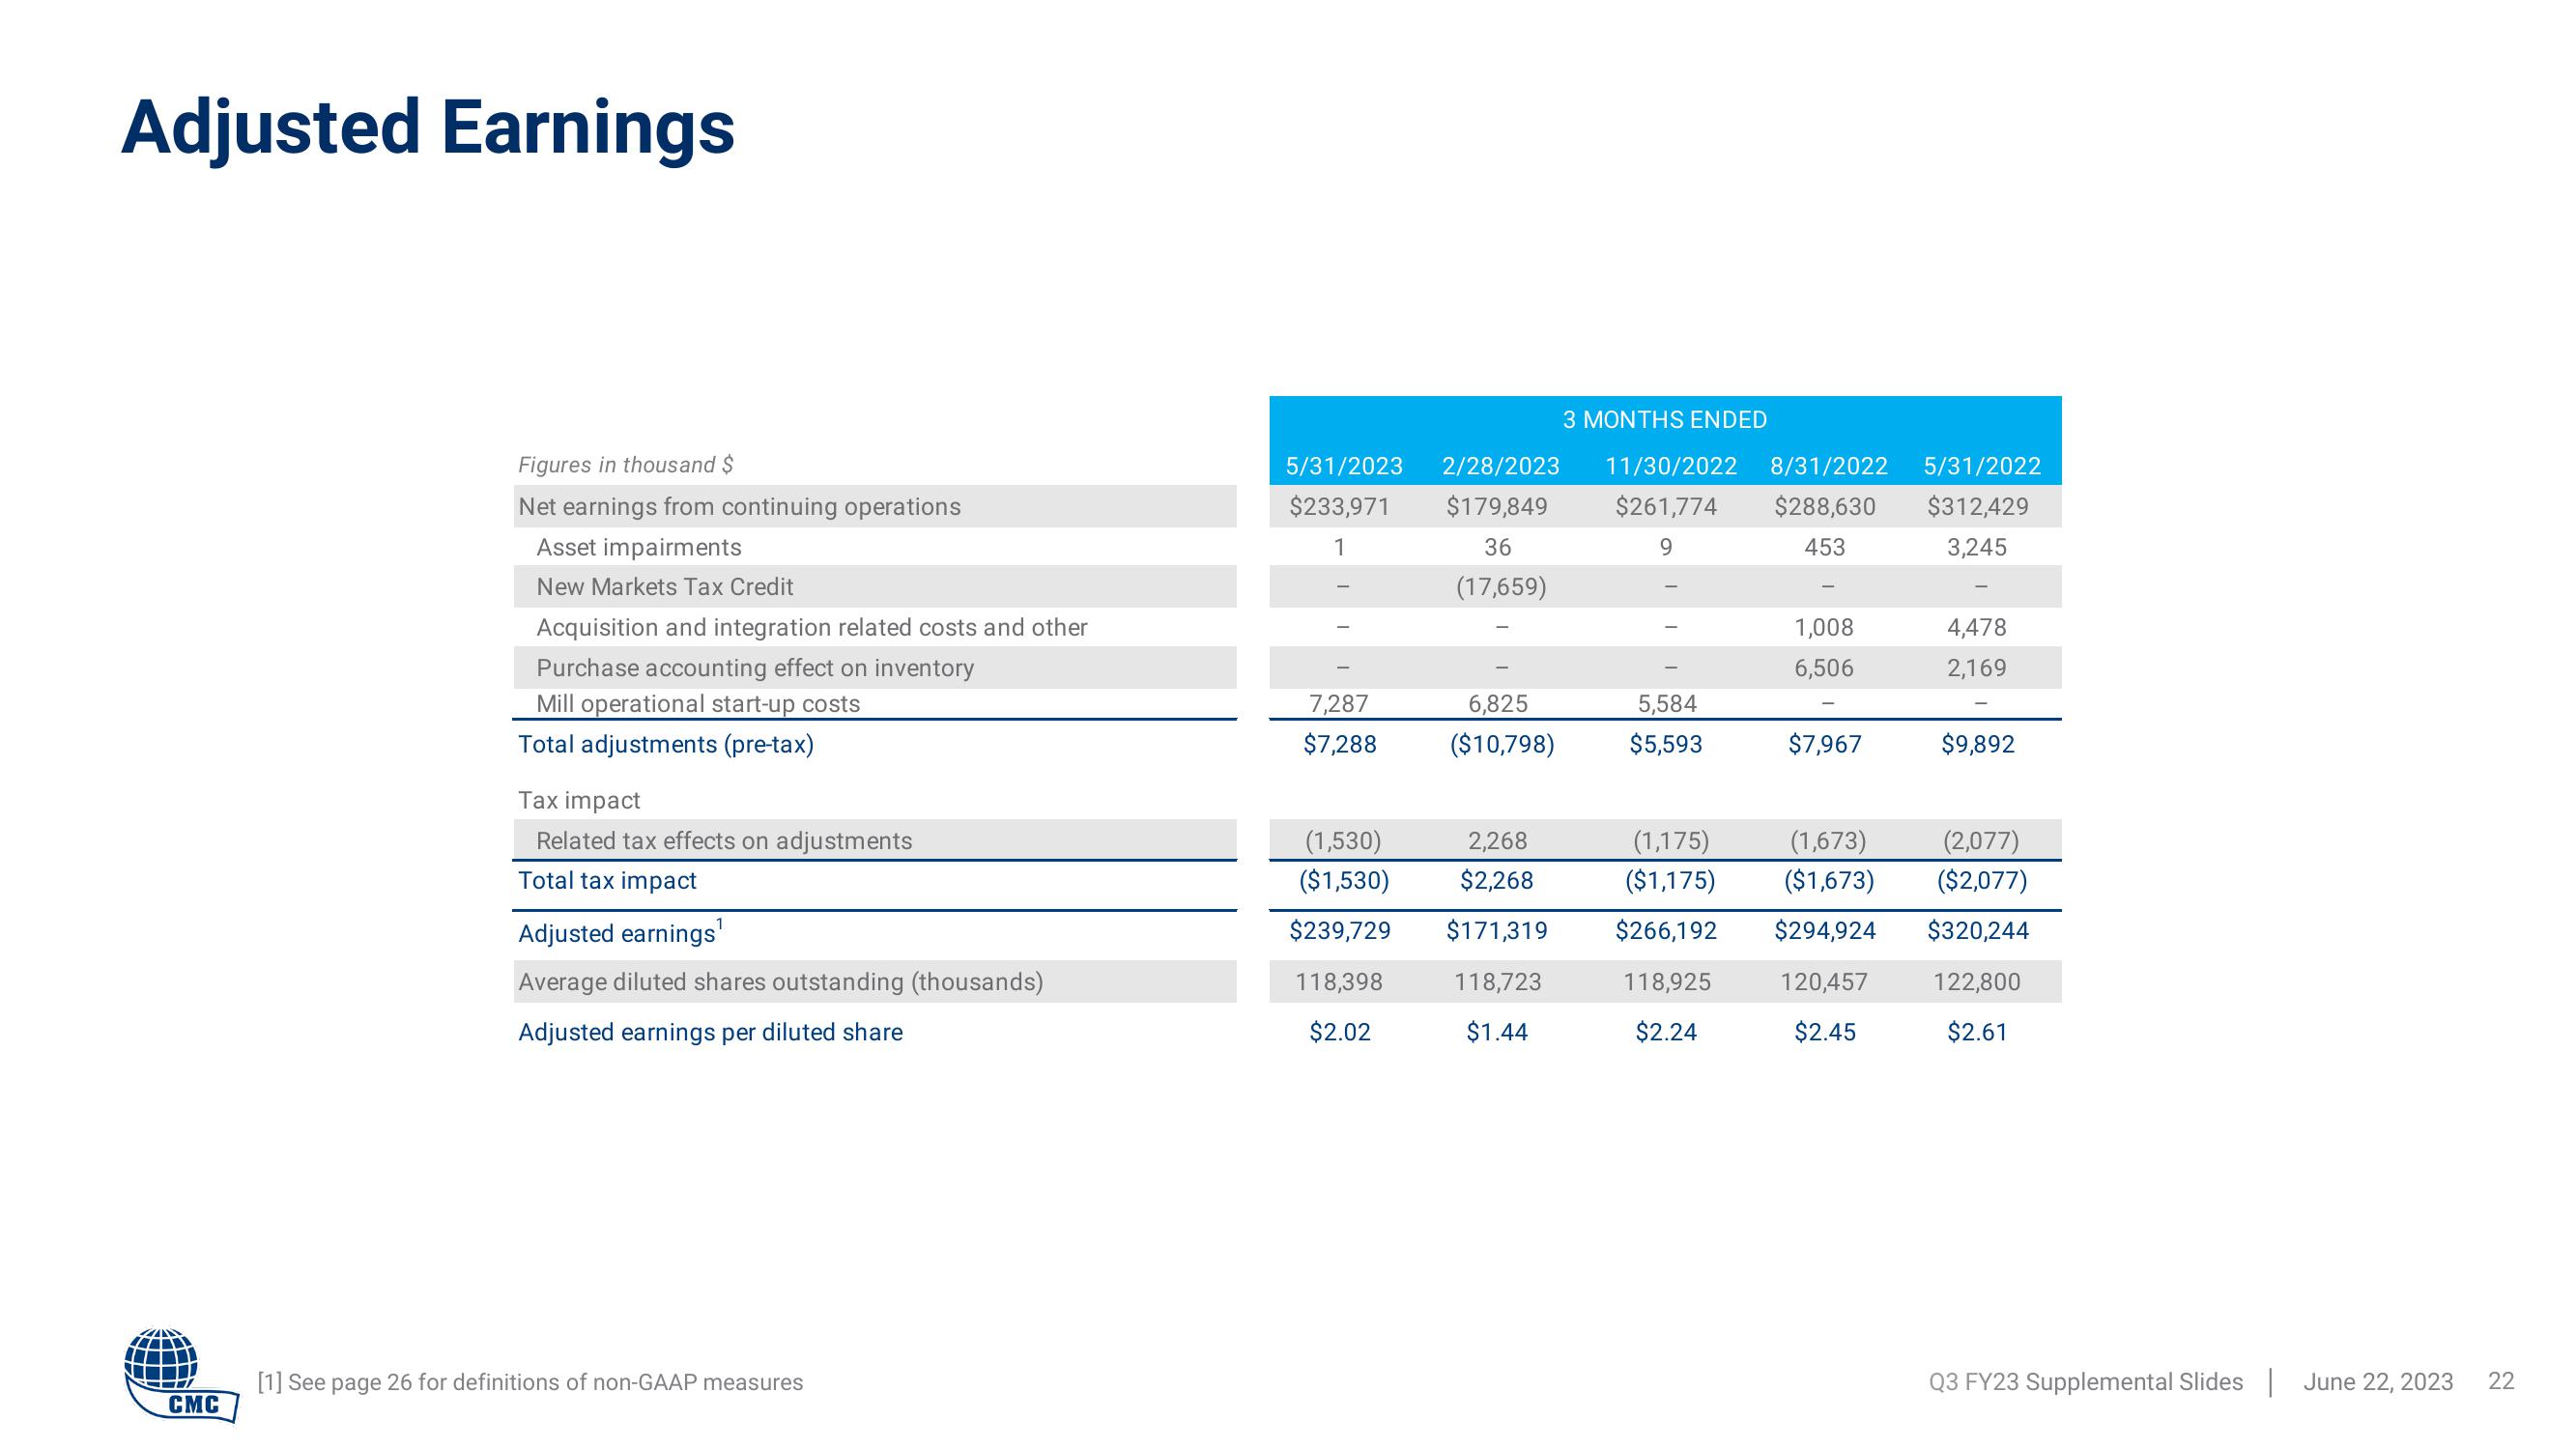
Adjusted Earnings
CMC
Figures in thousand $
Net earnings from continuing operations
Asset impairments
New Markets Tax Credit
Acquisition and integration related costs and other
Purchase accounting effect on inventory
Mill operational start-up costs
Total adjustments (pre-tax)
Tax impact
Related tax effects on adjustments
Total tax impact
Adjusted earnings¹
Average diluted shares outstanding (thousands)
Adjusted earnings per diluted share
[1] See page 26 for definitions of non-GAAP measures
5/31/2023 2/28/2023
$233,971 $179,849
1
36
(17,659)
7,287
$7,288
(1,530)
($1,530)
$239,729
118,398
$2.02
6,825
($10,798)
2,268
$2,268
$171,319
118,723
$1.44
3 MONTHS ENDED
11/30/2022 8/31/2022
$261,774 $288,630
9
453
5,584
$5,593
1,008
6,506
$7,967
(1,175) (1,673)
($1,175) ($1,673)
$266,192 $294,924
118,925 120,457
$2.45
$2.24
5/31/2022
$312,429
3,245
4,478
2,169
$9,892
(2,077)
($2,077)
$320,244
122,800
$2.61
Q3 FY23 Supplemental Slides June 22, 2023
22View entire presentation