Maersk Investor Presentation Deck
●
1
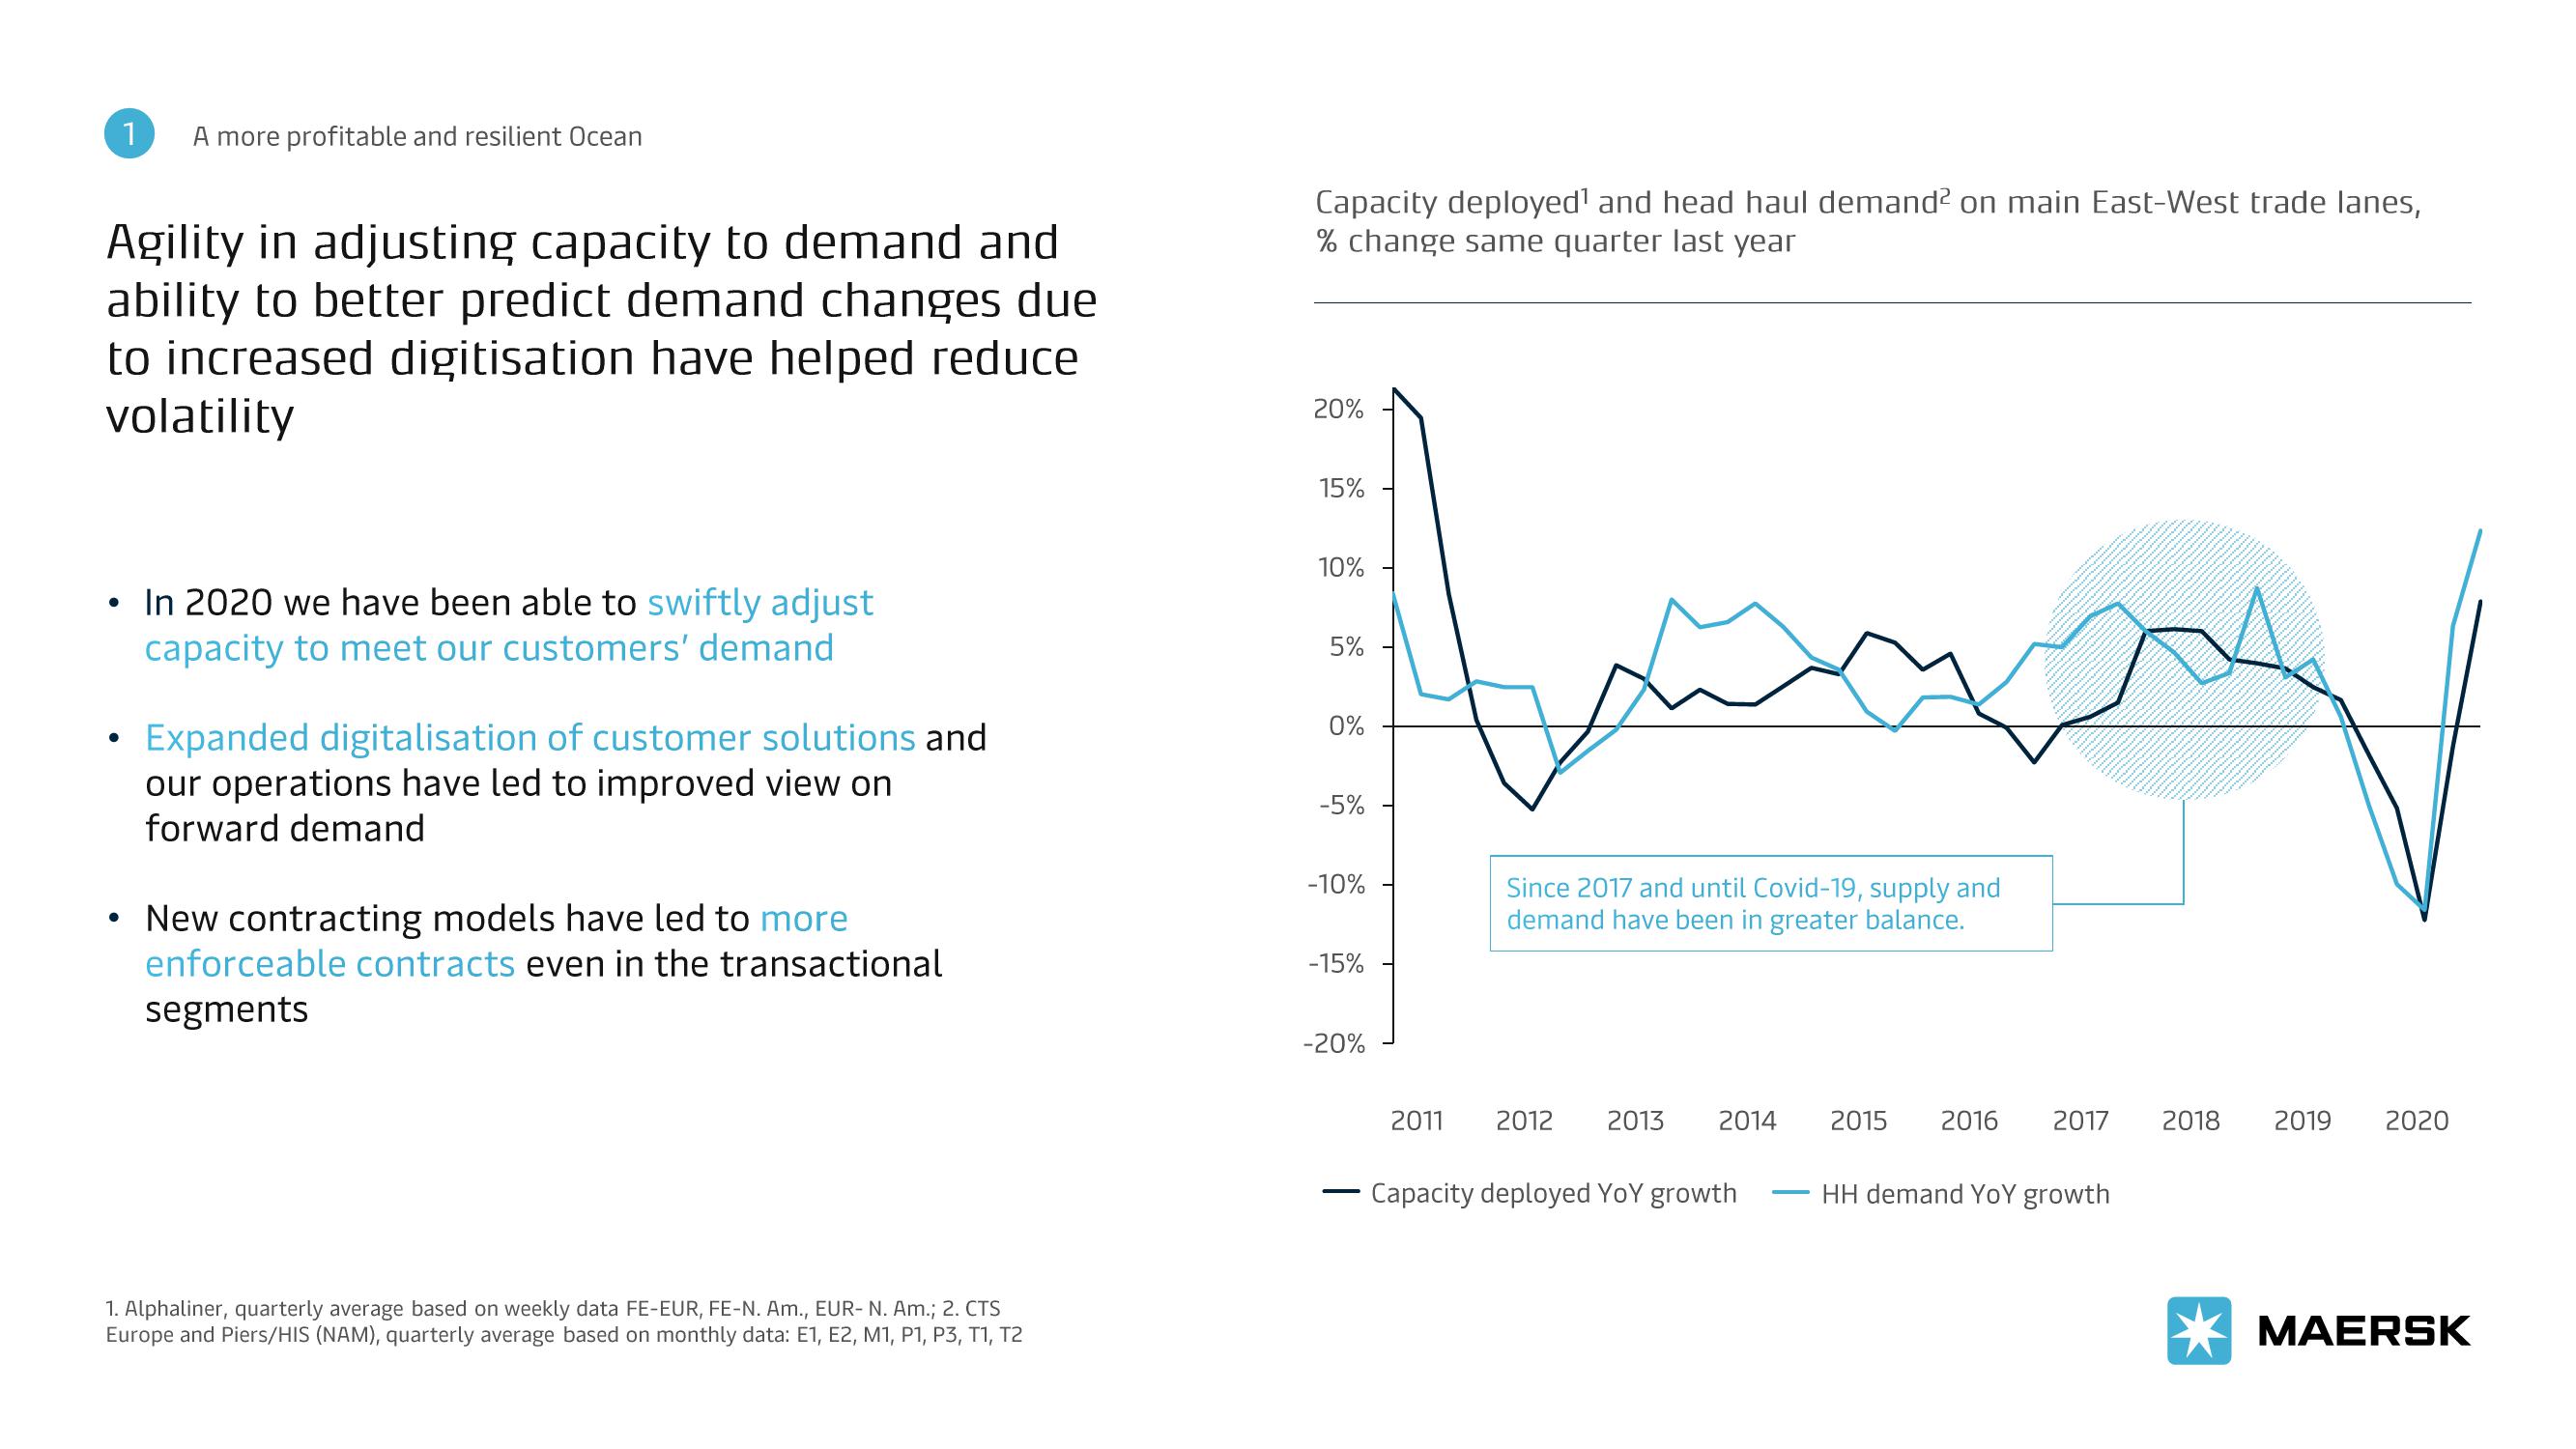
Agility in adjusting capacity to demand and
ability to better predict demand changes due
to increased digitisation have helped reduce
volatility
●
●
A more profitable and resilient Ocean
In 2020 we have been able to swiftly adjust
capacity to meet our customers' demand
Expanded digitalisation of customer solutions and
our operations have led to improved view on
forward demand
New contracting models have led to more
enforceable contracts even in the transactional
segments
1. Alphaliner, quarterly average based on weekly data FE-EUR, FE-N. Am., EUR- N. Am.; 2. CTS
Europe and Piers/HIS (NAM), quarterly average based on monthly data: E1, E2, M1, P1, P3, T1, T2
Capacity deployed¹ and head haul demand² on main East-West trade lanes,
% change same quarter last year
20%
15%
10%
5%
0%
-5%
-10%
-15%
-20%
Since 2017 and until Covid-19, supply and
demand have been in greater balance.
2011 2012
2013 2014
Capacity deployed YoY growth
2015 2016 2017
HH demand YoY growth
2018
2019
2020
MAERSKView entire presentation