Near SPAC Presentation Deck
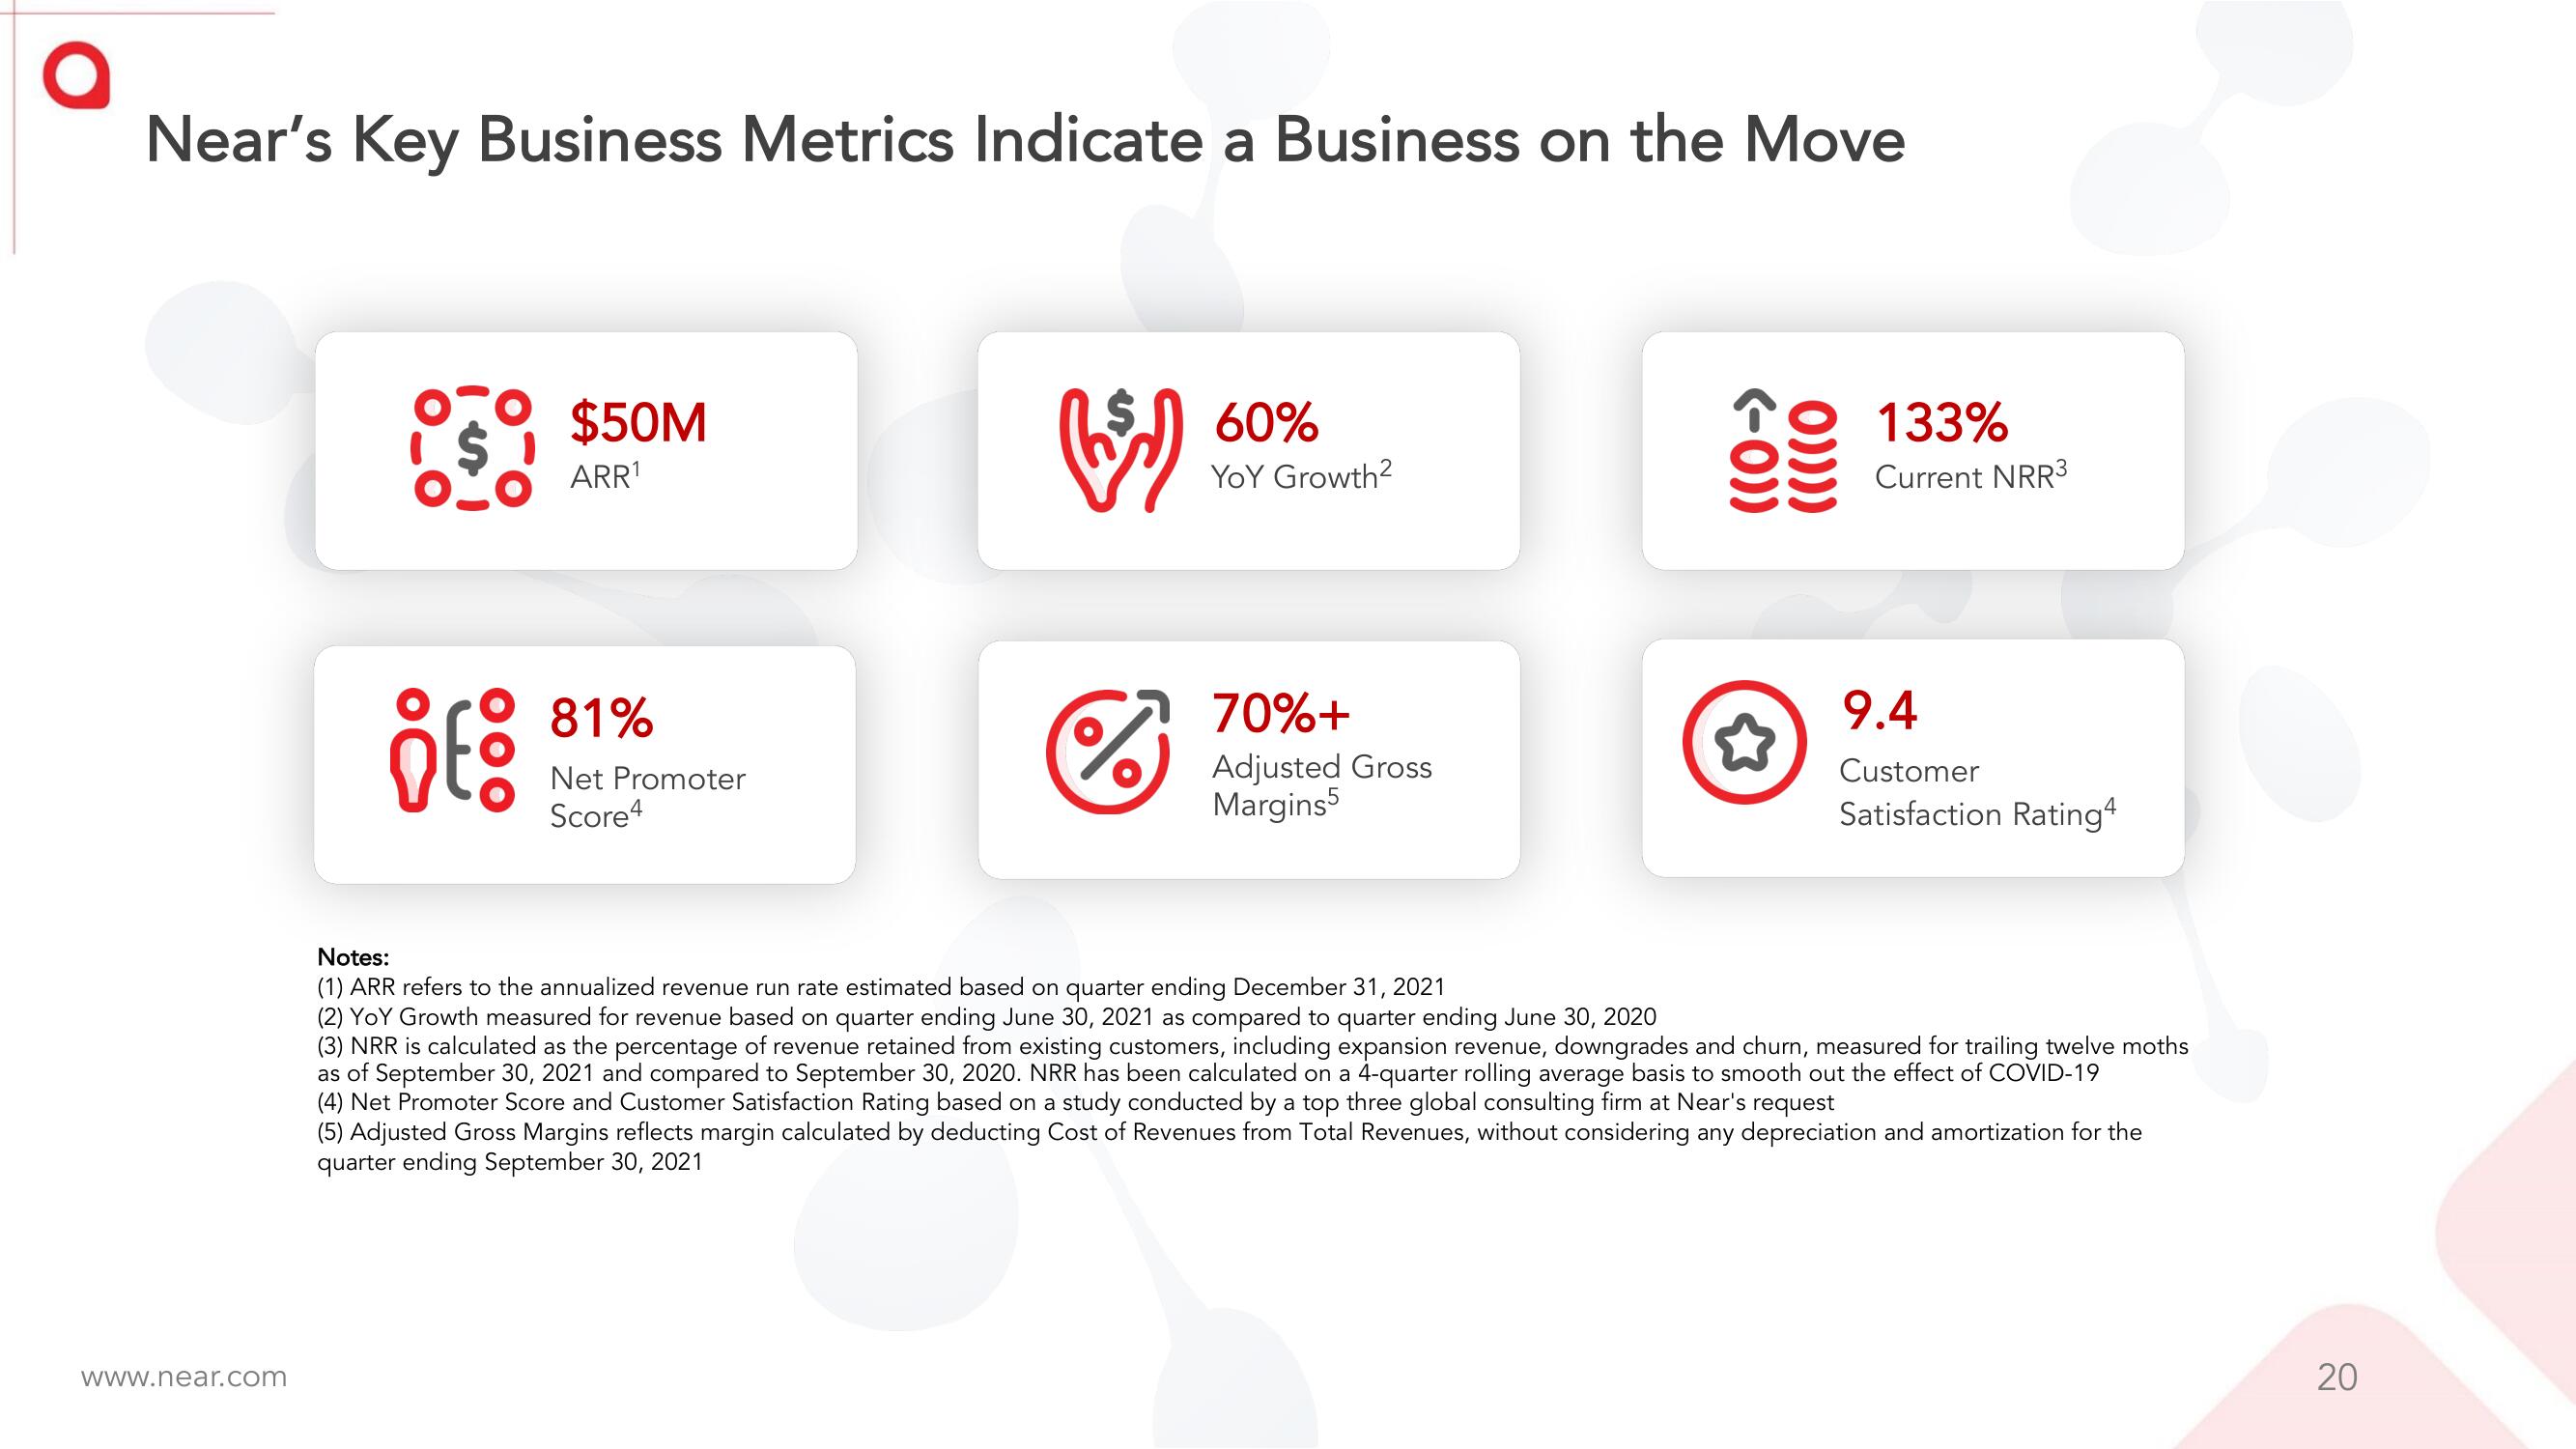
Near's Key Business Metrics Indicate a Business on the Move
www.near.com
$80
it:
$50M
ARR¹1
81%
Net Promoter
Score4
(5)
%
60%
YOY Growth²
70%+
Adjusted Gross
Margins5
<-0))
())))
☆
133%
Current NRR³
9.4
Customer
Satisfaction Rating4
Notes:
(1) ARR refers to the annualized revenue run rate estimated based on quarter ending December 31, 2021
(2) YoY Growth measured for revenue based on quarter ending June 30, 2021 as compared to quarter ending June 30, 2020
(3) NRR is calculated as the percentage of revenue retained from existing customers, including expansion revenue, downgrades and churn, measured for trailing twelve moths
as of September 30, 2021 and compared to September 30, 2020. NRR has been calculated on a 4-quarter rolling average basis to smooth out the effect of COVID-19
(4) Net Promoter Score and Customer Satisfaction Rating based on a study conducted by a top three global consulting firm at Near's request
(5) Adjusted Gross Margins reflects margin calculated by deducting Cost of Revenues from Total Revenues, without considering any depreciation and amortization for the
quarter ending September 30, 2021
20View entire presentation