HBT Financial Results Presentation Deck
Capital and Liquidity Overview
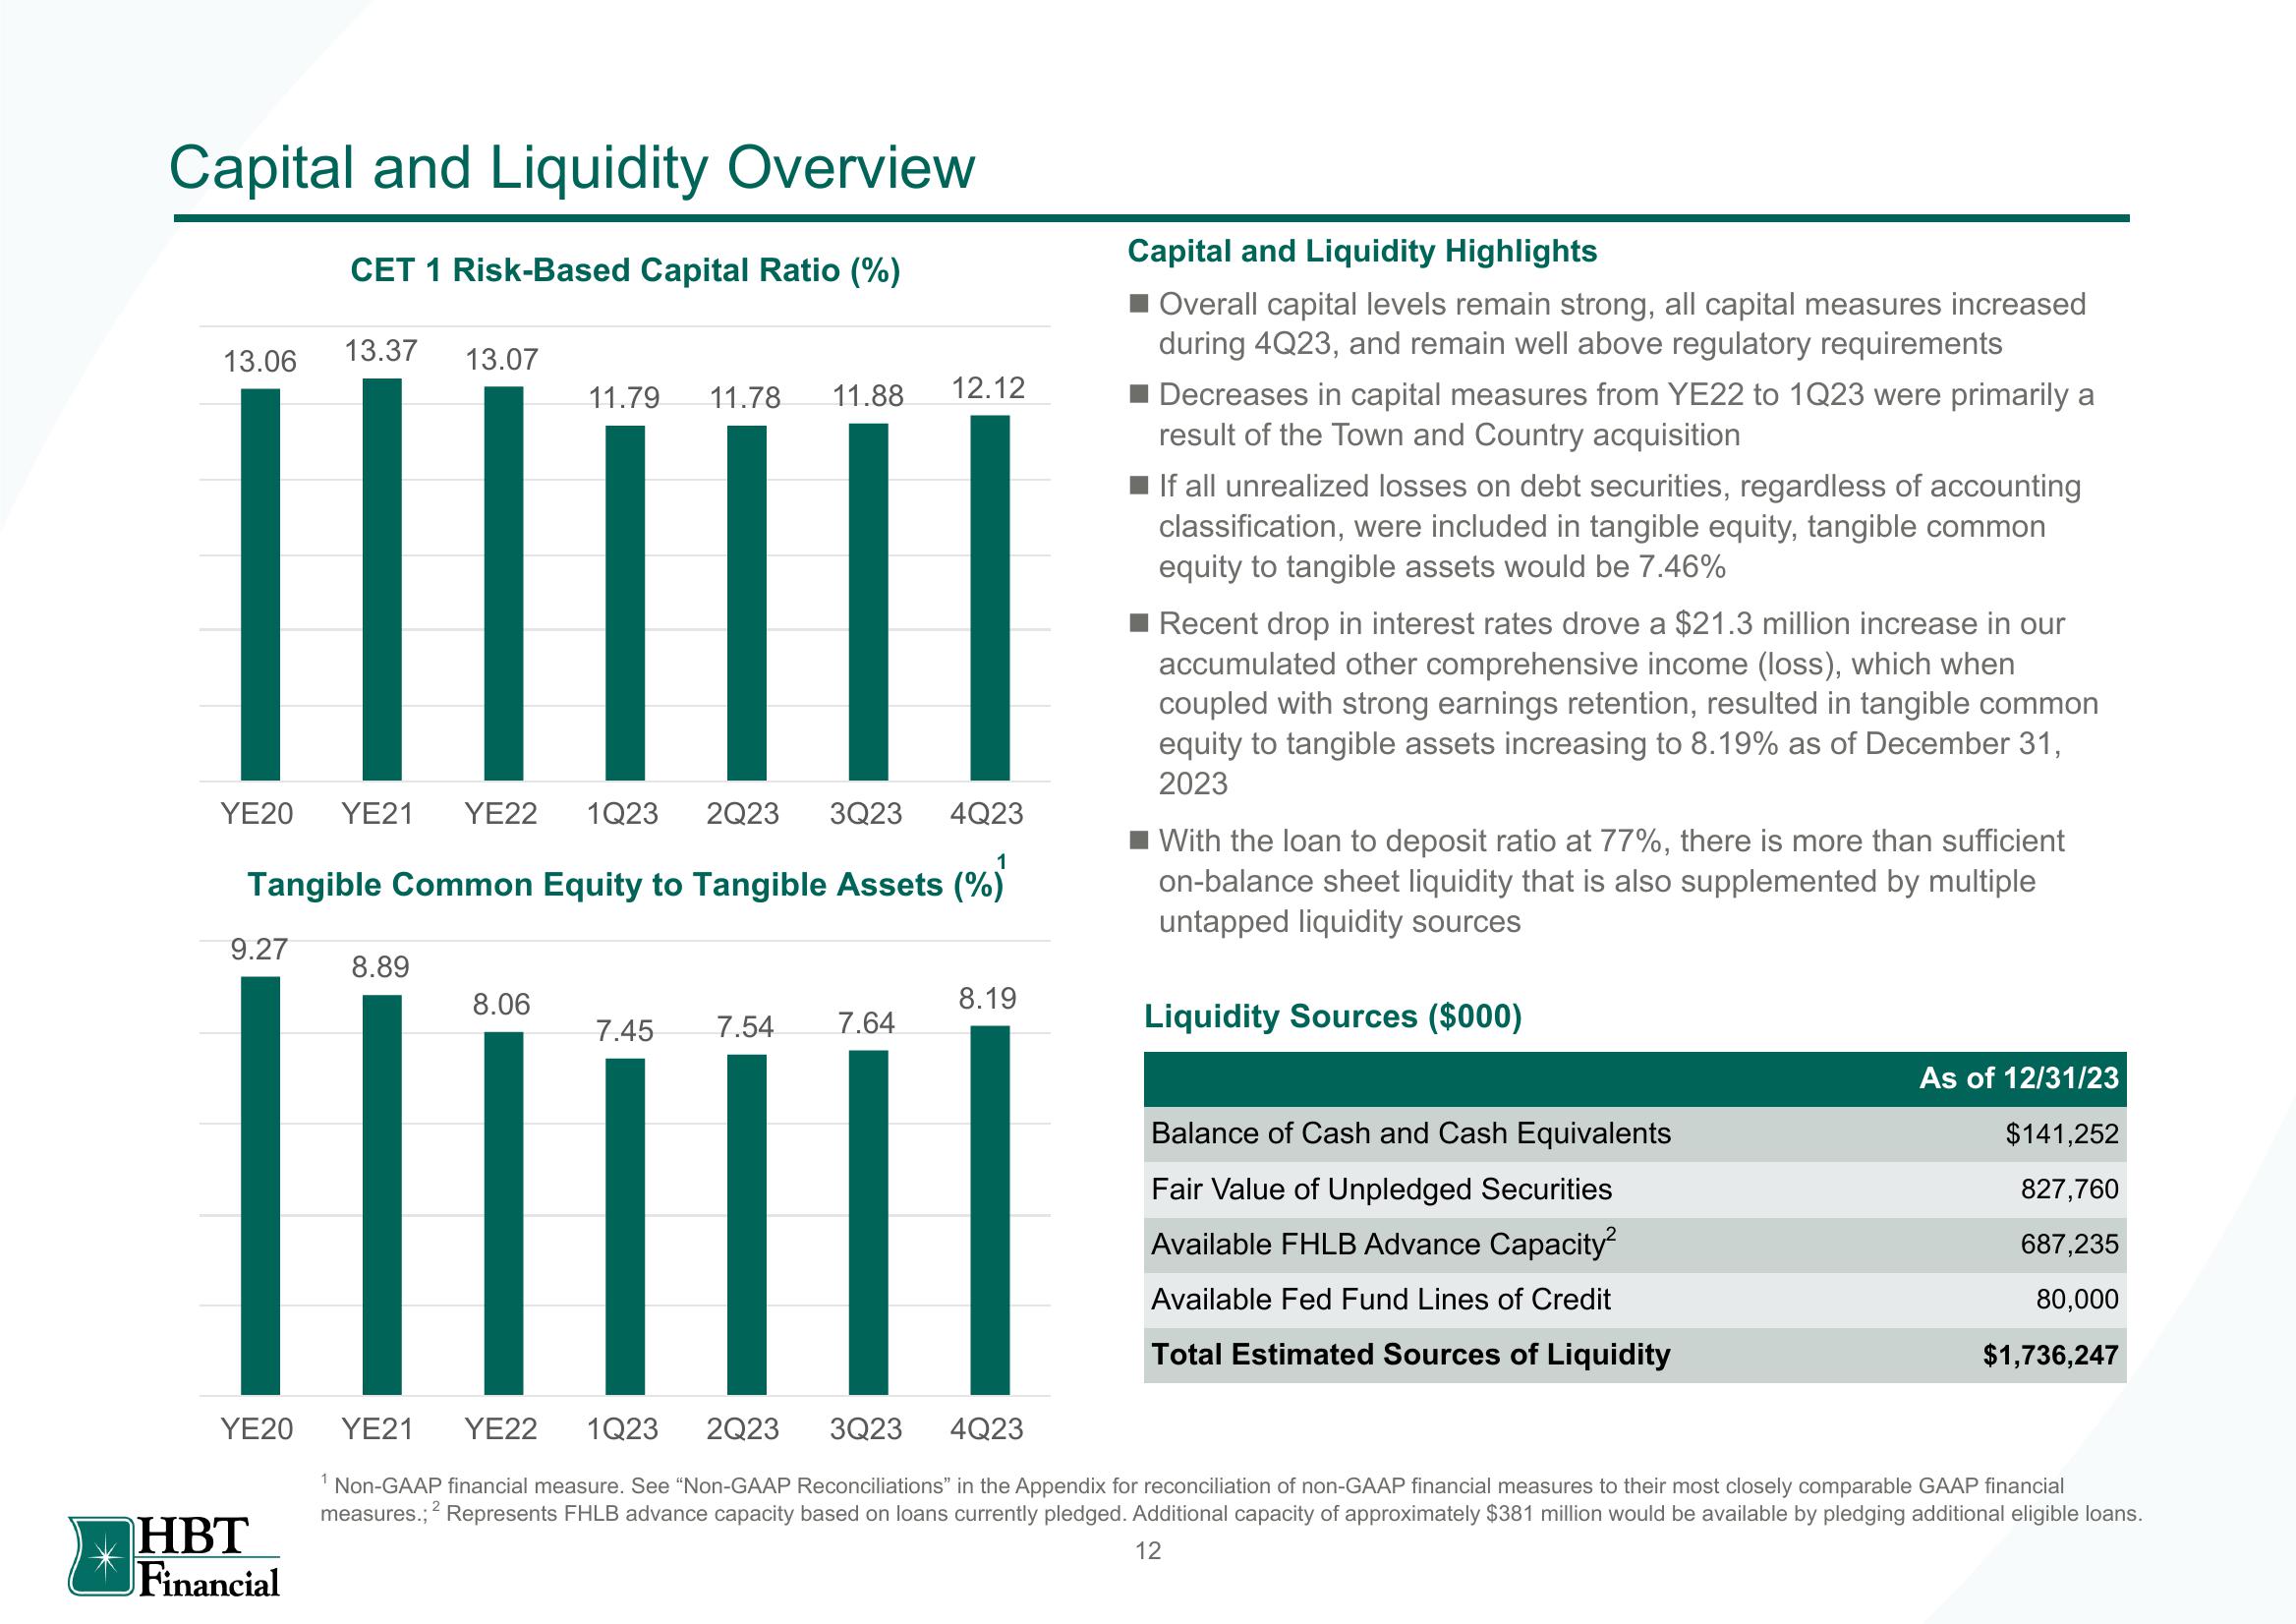
CET 1 Risk-Based Capital Ratio (%)
13.06
9.27
13.37
YE20 YE21 YE22 1Q23 2Q23 3Q23 4Q23
Tangible Common Equity to Tangible Assets (%)
1
HBT
Financial
13.07
8.89
1
11.79 11.78 11.88
12.12
8.06
7.45 7.54 7.64
|||||||
8.19
Capital and Liquidity Highlights
■ Overall capital levels remain strong, all capital measures increased
during 4Q23, and remain well above regulatory requirements
Decreases in capital measures from YE22 to 1Q23 were primarily a
result of the Town and Country acquisition
If all unrealized losses on debt securities, regardless of accounting
classification, were included in tangible equity, tangible common
equity to tangible assets would be 7.46%
Recent drop in interest rates drove a $21.3 million increase in our
accumulated other comprehensive income (loss), which when
coupled with strong earnings retention, resulted in tangible common
equity to tangible assets increasing to 8.19% as of December 31,
2023
With the loan to deposit ratio at 77%, there is more than sufficient
on-balance sheet liquidity that is also supplemented by multiple
untapped liquidity sources
Liquidity Sources ($000)
Balance of Cash and Cash Equivalents
Fair Value of Unpledged Securities
Available FHLB Advance Capacity²
Available Fed Fund Lines of Credit
Total Estimated Sources of Liquidity
YE20 YE21 YE22 1Q23
2Q23 3Q23 4Q23
Non-GAAP financial measure. See "Non-GAAP Reconciliations" in the Appendix for reconciliation of non-GAAP financial measures to their most closely comparable GAAP financial
measures.; 2 Represents FHLB advance capacity based on loans currently pledged. Additional capacity of approximately $381 million would be available by pledging additional eligible loans.
12
As of 12/31/23
$141,252
827,760
687,235
80,000
$1,736,247View entire presentation