Missfresh IPO Presentation Deck
Financial Highlights Summary
优鲜
G
优鲜
0.0
High Value Customer Base at Scale
Strong Quality Growth in GMV and
Revenue
Solid Economy Model with Clear Path
to Profitability
Healthy Cash Flow Management
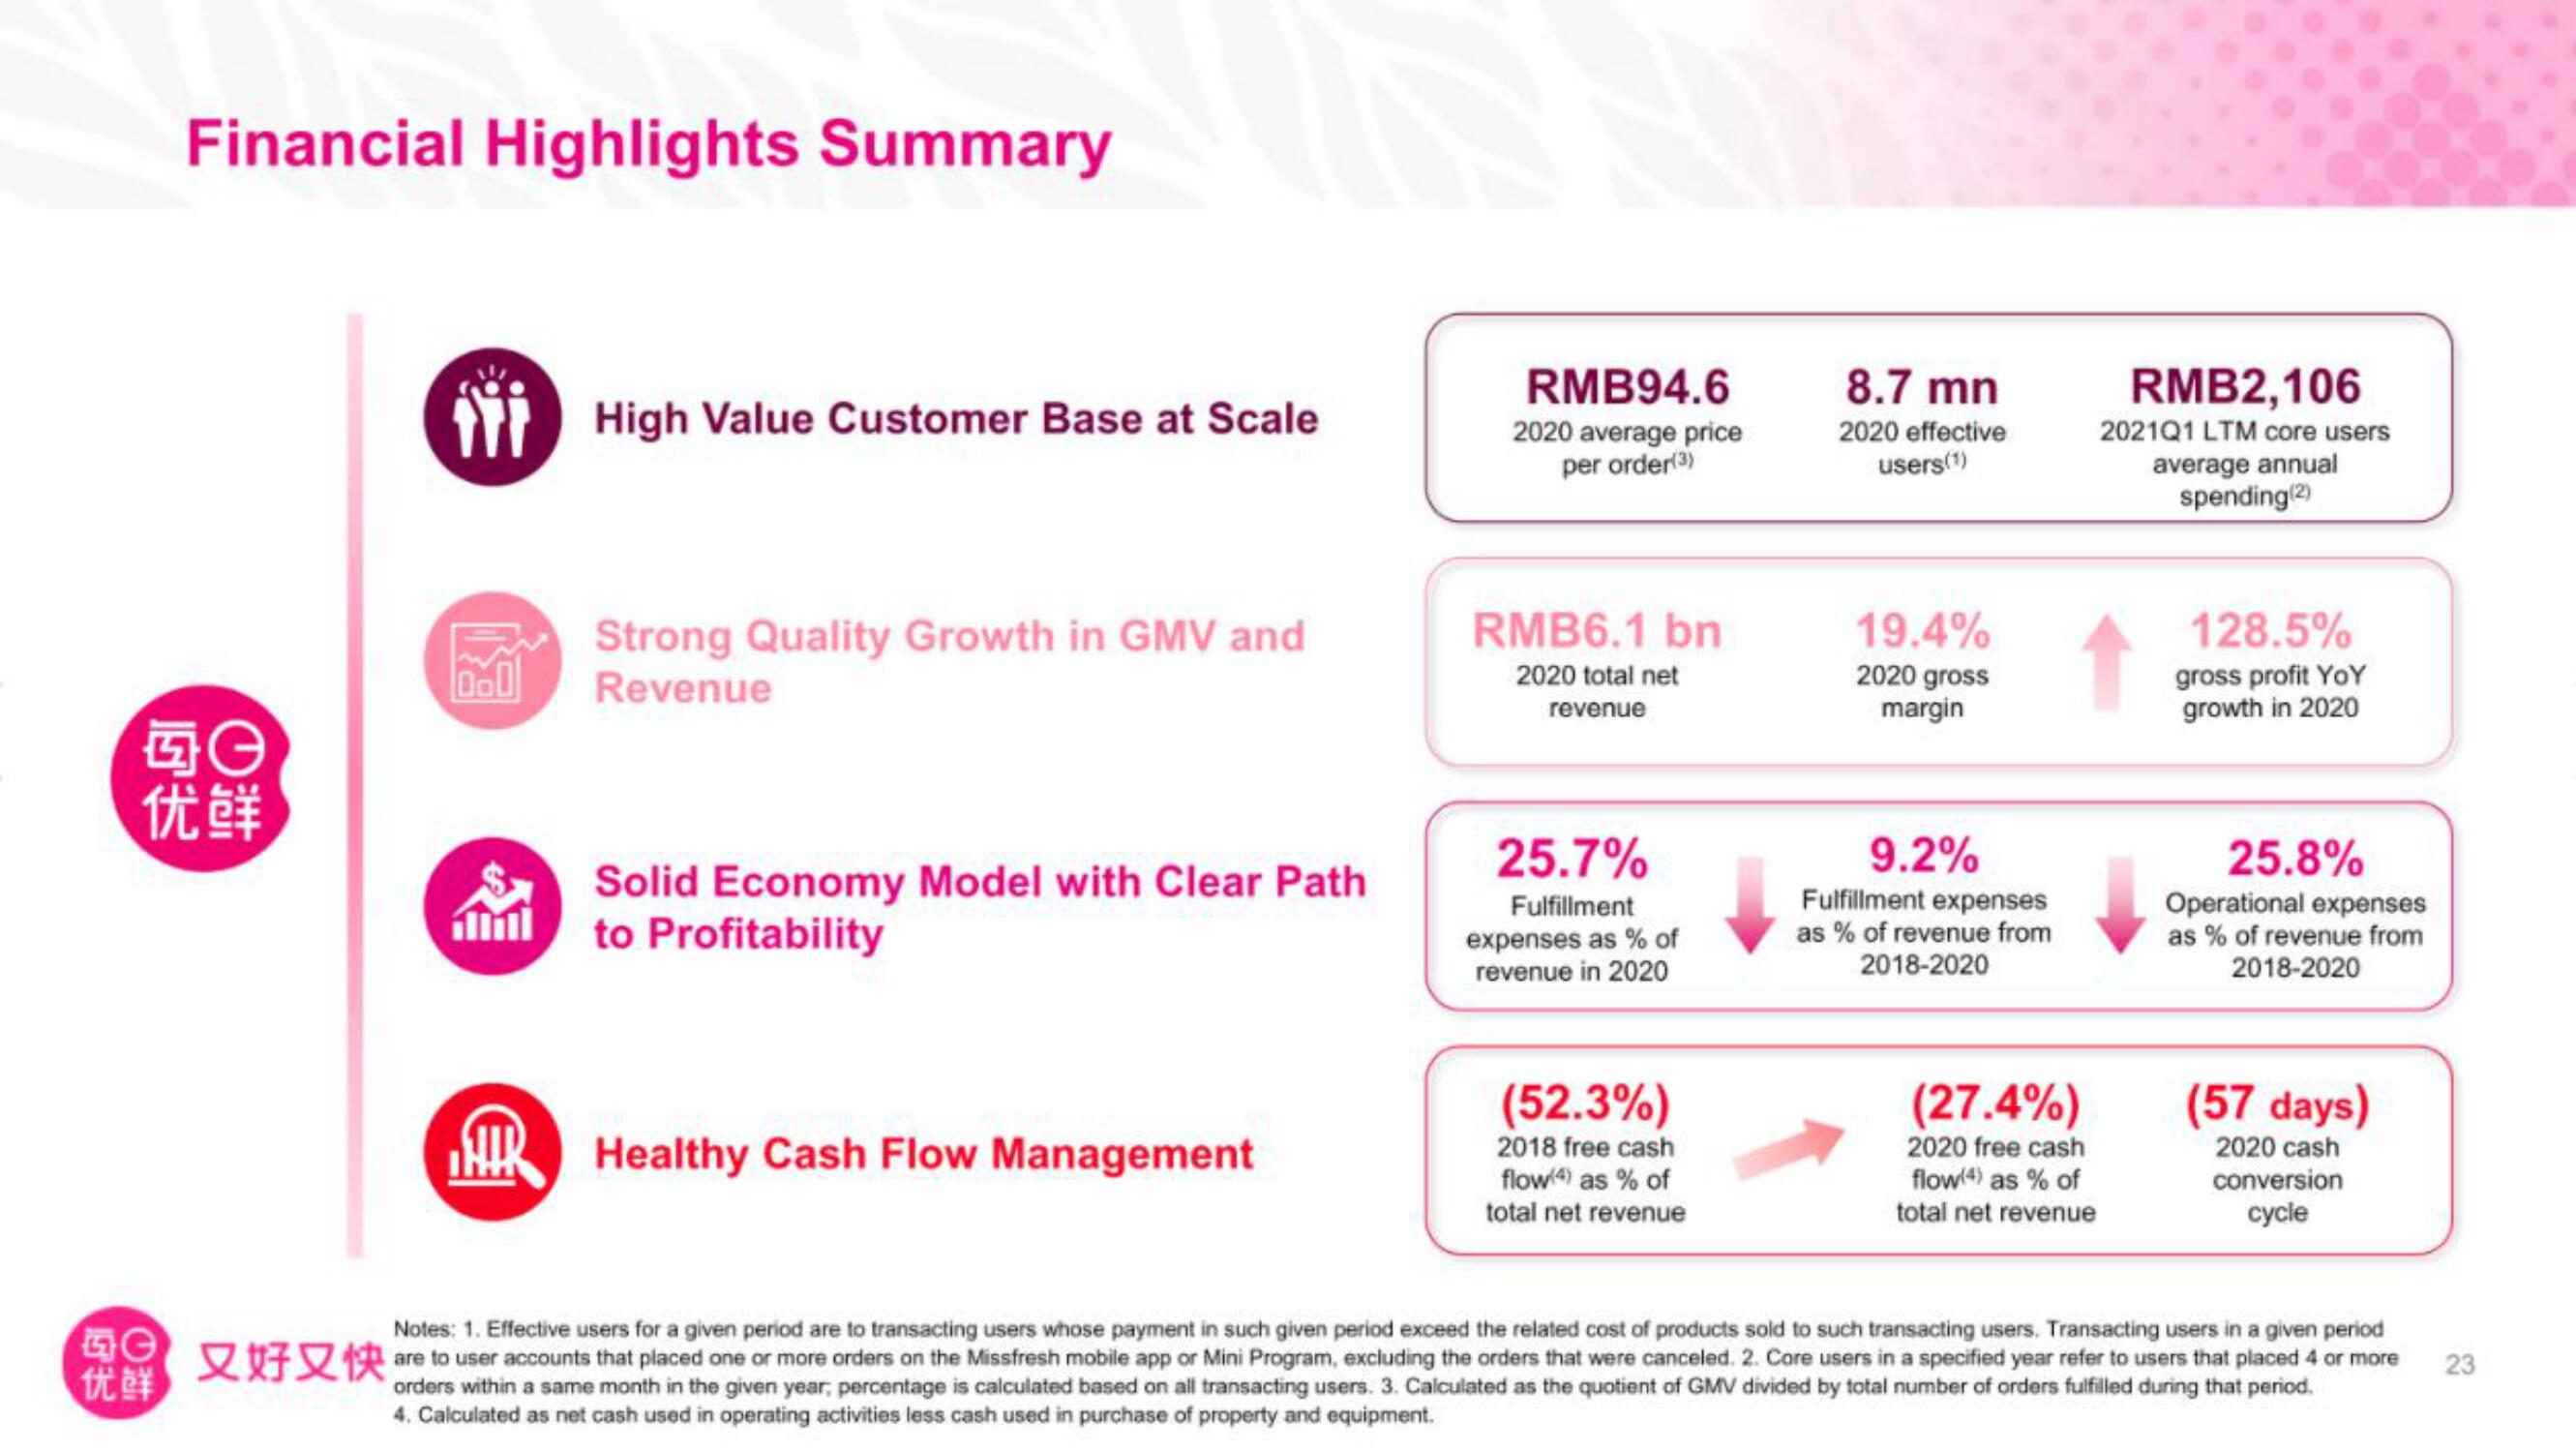
RMB94.6
2020 average price
per order (3)
RMB6.1 bn
2020 total net
revenue
25.7%
Fulfillment
expenses as % of
revenue in 2020
(52.3%)
2018 free cash
flow(4) as % of
total net revenue
8.7 mn
2020 effective
users(1)
19.4%
2020 gross
margin
9.2%
Fulfillment expenses
as % of revenue from
2018-2020
(27.4%)
2020 free cash
flow (4) as % of
total net revenue
RMB2,106
2021Q1 LTM core users
average annual
spending (2)
128.5%
gross profit YoY
growth in 2020
25.8%
Operational expenses
as % of revenue from
2018-2020
(57 days)
2020 cash
conversion
cycle
Notes: 1. Effective users for a given period are to transacting users whose payment in such given period exceed the related cost of products sold to such transacting users. Transacting users in a given period
又好又快 are to user accounts that placed one or more orders on the Missfresh mobile app or Mini Program, excluding the orders that were canceled. 2. Core users in a specified year refer to users that placed 4 or more 23
orders within a same month in the given year, percentage is calculated based on all transacting users. 3. Calculated as the quotient of GMV divided by total number of orders fulfilled during that period.
4. Calculated as net cash used in operating activities less cash used in purchase of property and equipment.View entire presentation