Freshworks Investor Day Presentation Deck
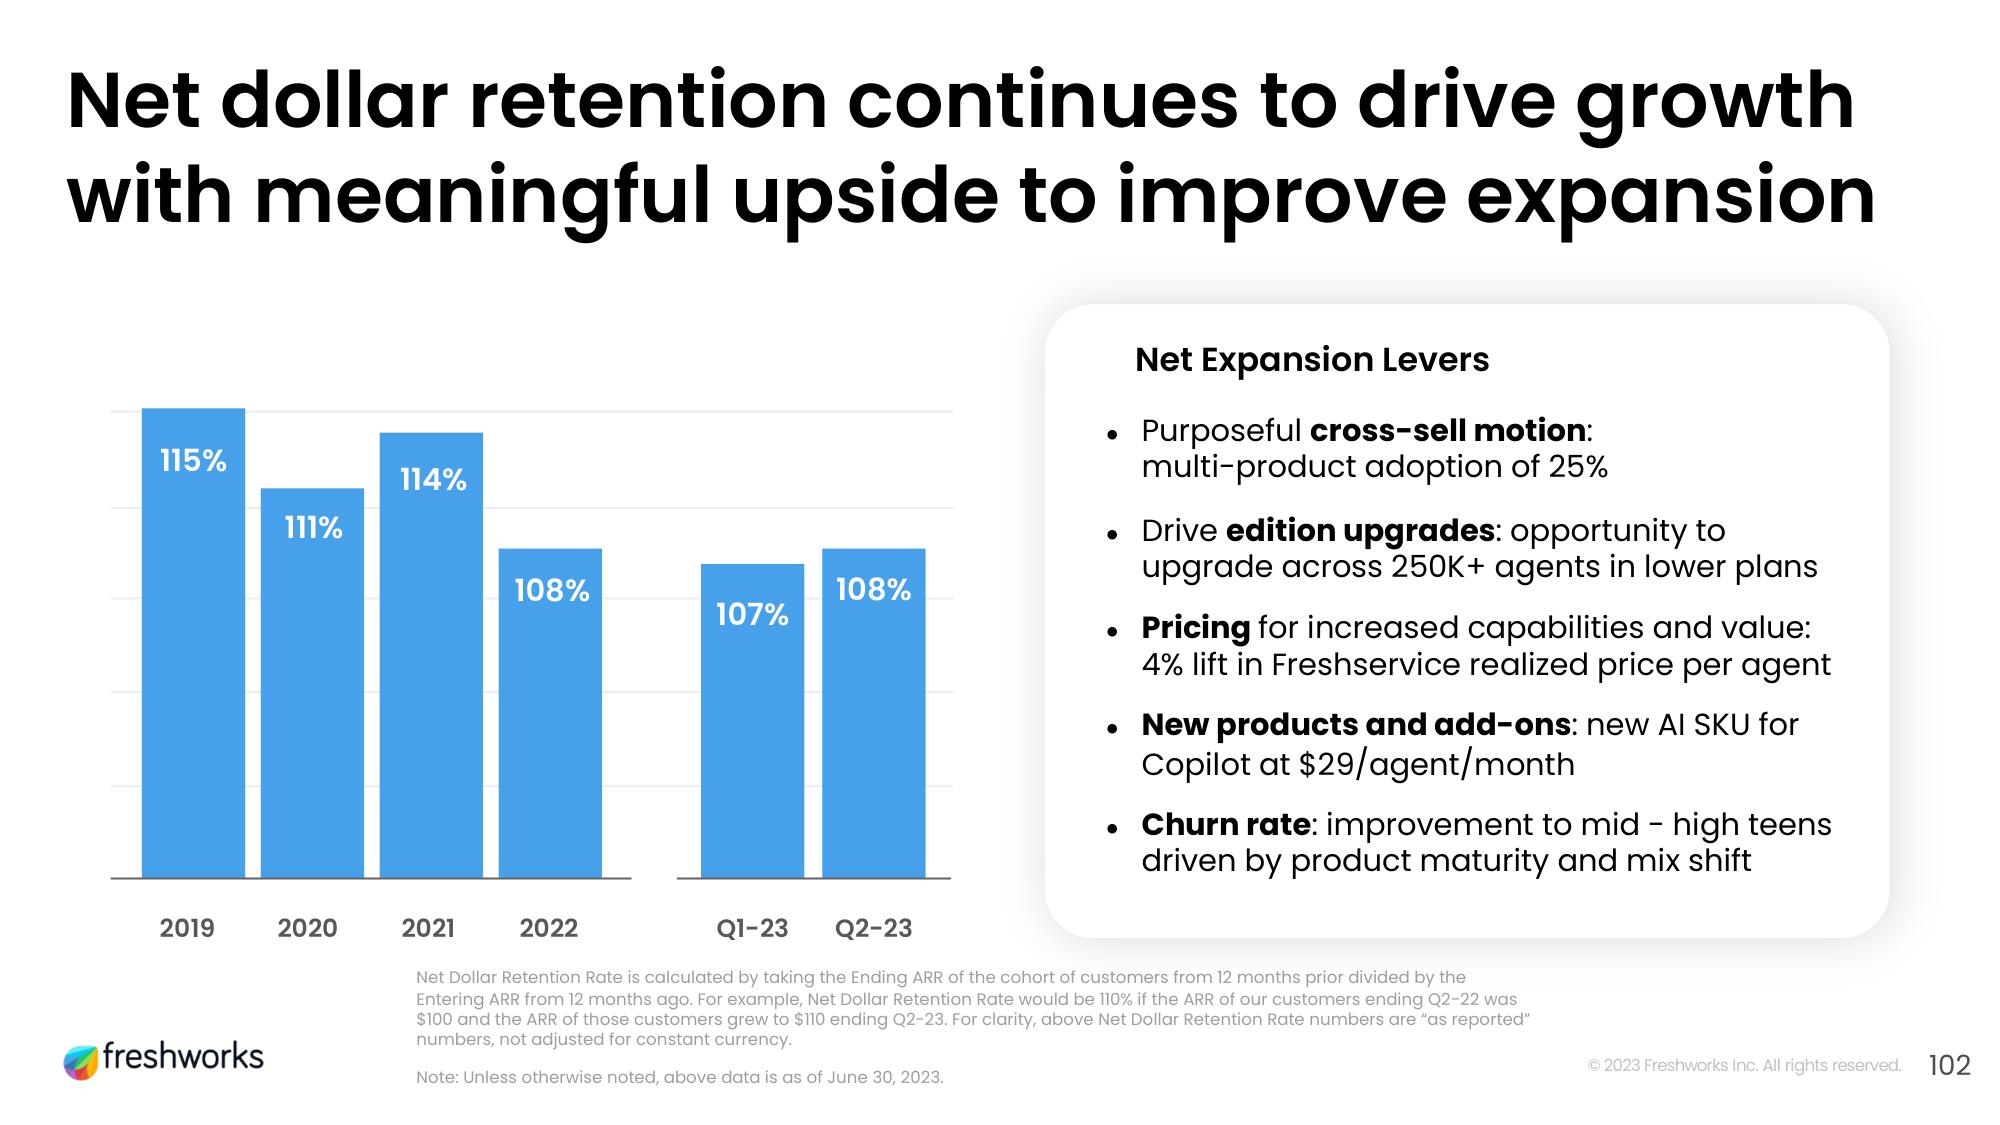
Net dollar retention continues to drive growth
with meaningful upside to improve expansion
115%
2019
freshworks
111%
2020
114%
108%
107%
2022
108%
Net Expansion Levers
Purposeful cross-sell motion:
multi-product adoption of 25%
• Drive edition upgrades: opportunity to
upgrade across 250K+ agents in lower plans
●
Pricing for increased capabilities and value:
4% lift in Freshservice realized price per agent
• New products and add-ons: new AI SKU for
Copilot at $29/agent/month
Churn rate: improvement to mid - high teens
driven by product maturity and mix shift
2021
Q1-23
Q2-23
Net Dollar Retention Rate is calculated by taking the Ending ARR of the cohort of customers from 12 months prior divided by the
Entering ARR from 12 months ago. For example, Net Dollar Retention Rate would be 110% if the ARR of our customers ending Q2-22 was
$100 and the ARR of those customers grew to $110 ending Q2-23. For clarity, above Net Dollar Retention Rate numbers are "as reported"
numbers, not adjusted for constant currency.
Note: Unless otherwise noted, above data is as of June 30, 2023.
Ⓒ2023 Freshworks Inc. All rights reserved.
102View entire presentation