Presentation to Vermont Pension Investment Committee
Correlation Analysis: Private Asset-Focused Investments
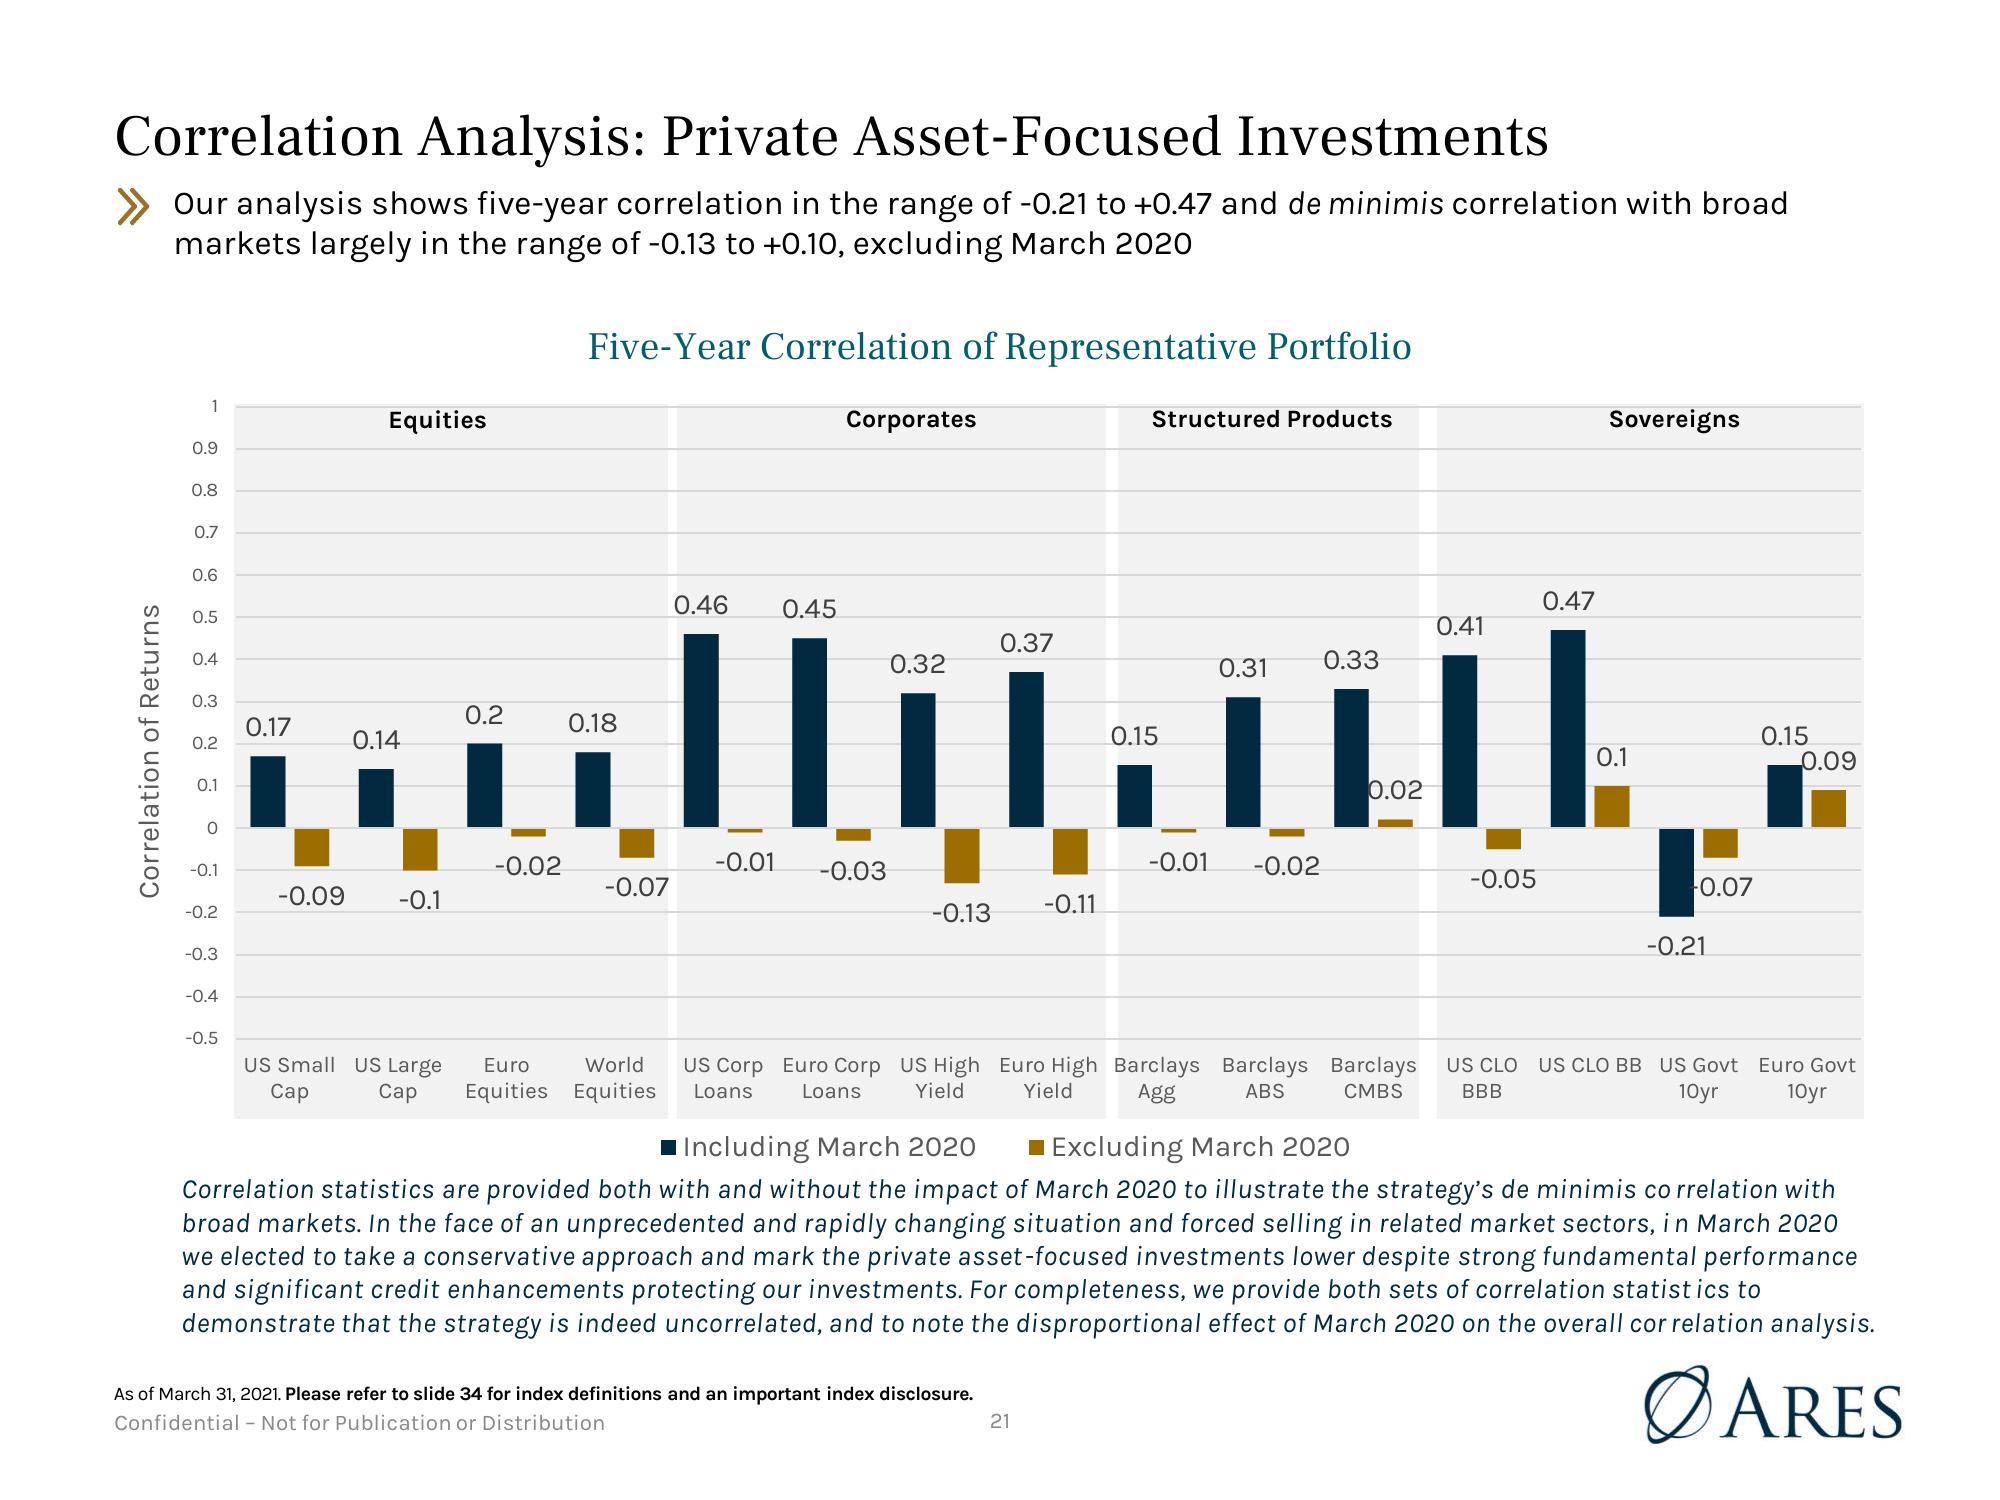
Our analysis shows five-year correlation in the range of -0.21 to +0.47 and de minimis correlation with broad
markets largely in the range of -0.13 to +0.10, excluding March 2020
Correlation of Returns
1
0.9
0.8
0.7
0.6
0.5
0.4
0.3
0.2
0.1
O
-0.1
-0.2
-0.3
-0.4
-0.5
0.17
Equities
0.14
-0.09 -0.1
0.2
-0.02
Five-Year Correlation of Representative Portfolio
0.18
0.45
0.32
111
-0.01
-0.03
-0.07
World
US Small US Large Euro
Cap Cap Equities Equities
Corporates
0.46
-0.13
0.37
As of March 31, 2021. Please refer to slide 34 for index definitions and an important index disclosure.
Confidential - Not for Publication or Distribution
-0.11
Structured Products
21
0.15
0.31 0.33
-0.01 -0.02
US Corp Euro Corp US High Euro High Barclays Barclays Barclays
Loans Loans Yield
ABS
CMBS
Yield
Agg
0.02
0.47
0.41
||
-0.05
Sovereigns
0.1
-0.07
-0.21
0.15
0.09
Including March 2020
■ Excluding March 2020
Correlation statistics are provided both with and without the impact of March 2020 to illustrate the strategy's de minimis correlation with
broad markets. In the face of an unprecedented and rapidly changing situation and forced selling in related market sectors, in March 2020
we elected to take a conservative approach and mark the private asset-focused investments lower despite strong fundamental performance
and significant credit enhancements protecting our investments. For completeness, we provide both sets of correlation statistics to
demonstrate that the strategy is indeed uncorrelated, and to note the disproportional effect of March 2020 on the overall cor relation analysis.
ARES
US CLO US CLO BB US Govt Euro Govt
BBB
10yr 10yrView entire presentation