Trian Partners Activist Presentation Deck
Despite Achieving ~100% of Annual Bonuses Over Time, Management Rarely Achieves
Many of The Long-Term Performance Targets...Does the Board See the Disconnect?
■
■
■
I
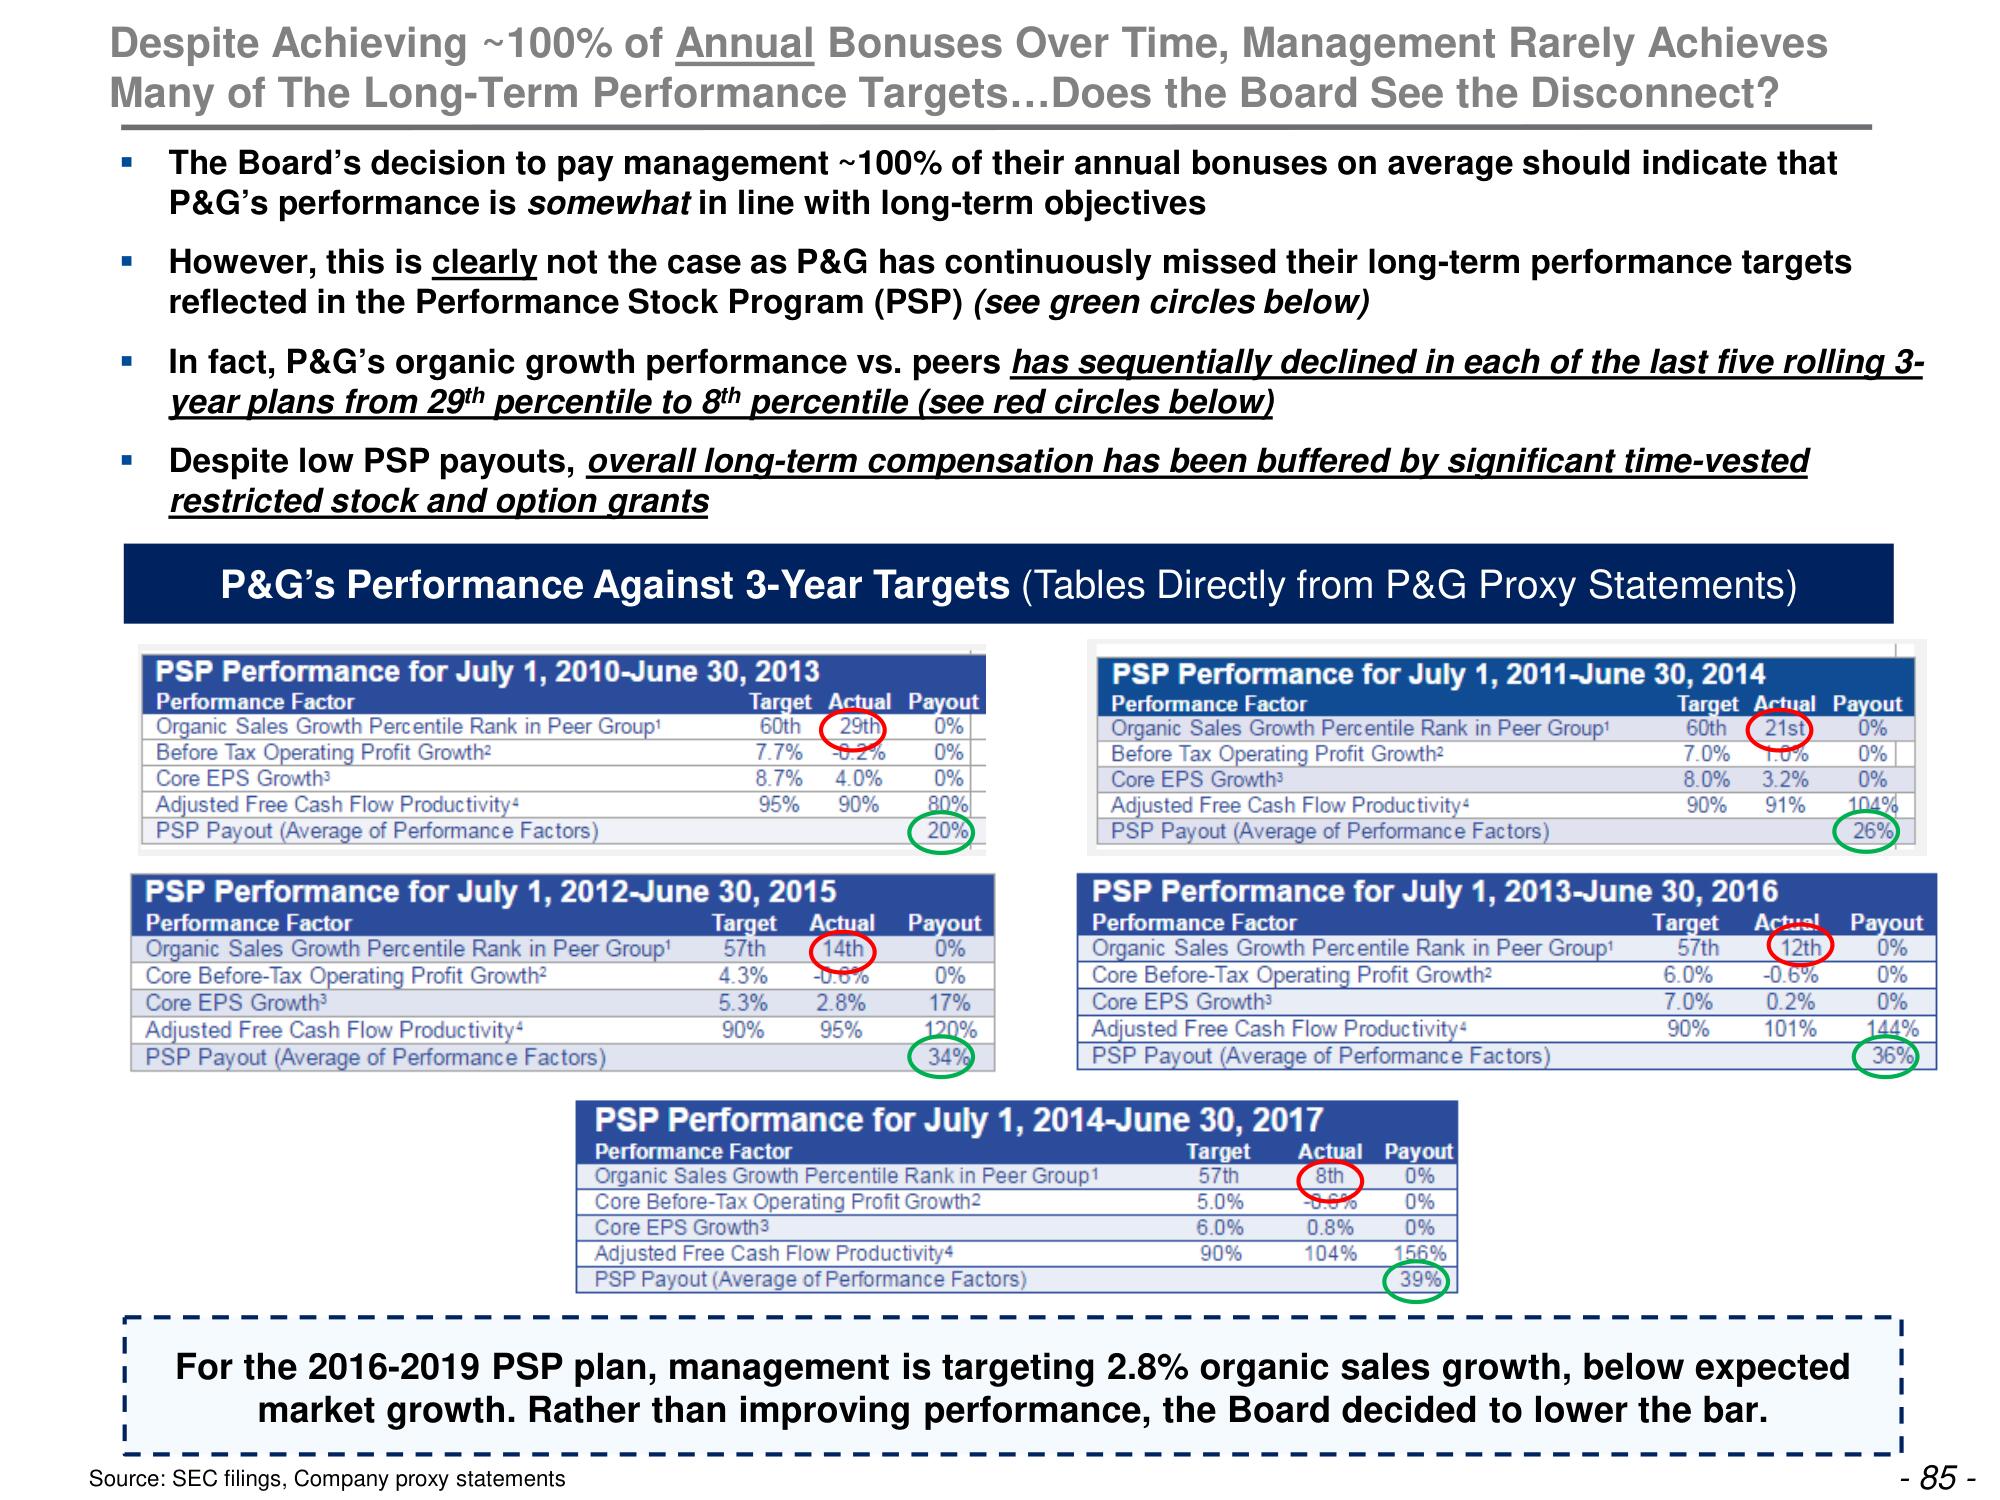
The Board's decision to pay management ~100% of their annual bonuses on average should indicate that
P&G's performance is somewhat in line with long-term objectives
However, this is clearly not the case as P&G has continuously missed their long-term performance targets
reflected in the Performance Stock Program (PSP) (see green circles below)
In fact, P&G's organic growth performance vs. peers has sequentially declined in each of the last five rolling 3-
year plans from 29th percentile to 8th percentile (see red circles below)
Despite low PSP payouts, overall long-term compensation has been buffered by significant time-vested
restricted stock and option grants
P&G's Performance Against 3-Year Targets (Tables Directly from P&G Proxy Statements)
PSP Performance for July 1, 2010-June 30, 2013
Performance Factor
Organic Sales Growth Percentile Rank in Peer Group¹
Before Tax Operating Profit Growth²
Core EPS Growth³
Adjusted Free Cash Flow Productivity4
PSP Payout (Average of Performance Factors)
Target Actual Payout
60th 29th 0%
7.7%
0%
0%
8.7%
95%
80%
20%
Adjusted Free Cash Flow Productivity
PSP Payout (Average of Performance Factors)
-0.2%
4.0%
90%
PSP Performance for July 1, 2012-June 30, 2015
Performance Factor
Organic Sales Growth Percentile Rank in Peer Group¹
Core Before-Tax Operating Profit Growth²
Core EPS Growth³
Target Actual Payout
57th
14th
0%
4.3%
0%
5.3%
17%
90%
120%
34%
-0.0%
2.8%
95%
PSP Performance for July 1, 2011-June 30, 2014
Performance Factor
Organic Sales Growth Percentile Rank in Peer Group¹
Before Tax Operating Profit Growth²
Core EPS Growth³
Adjusted Free Cash Flow Productivity4
PSP Payout (Average of Performance Factors)
Adjusted Free Cash Flow Productivity
PSP Payout (Average of Performance Factors)
Organic Sales Growth Percentile Rank in Peer Group 1
Core Before-Tax Operating Profit Growth2
Core EPS Growth3
Adjusted Free Cash Flow Productivity4
PSP Payout (Average of Performance Factors)
PSP Performance for July 1, 2014-June 30, 2017
Performance Factor
PSP Performance for July 1, 2013-June 30, 2016
Performance Factor
Organic Sales Growth Percentile Rank in Peer Group¹
Core Before-Tax Operating Profit Growth²
Core EPS Growth³
Target Actual
57th 12th
6.0% -0.6%
7.0%
0.2%
90%
101%
Target Actual Payout
57th
8th
0%
5.0%
0%
6.0%
0%
90%
156%
39%
Target Artual Payout
60th 21st
0%
-0.0 10
0.8%
104%
7.0% 1.0%
8.0% 3.2%
90% 91%
0%
0%
104%
26%
For the 2016-2019 PSP plan, management is targeting 2.8% organic sales growth, below expected
market growth. Rather than improving performance, the Board decided to lower the bar.
Source: SEC filings, Company proxy statements
Payout
0%
0%
0%
144%
36%
- 85 -View entire presentation