Overstock Results Presentation Deck
18
16
14
12
10
8
6
4
2
0
Full Year '18
Monthly Average
Q4 '18
Monthly Average
Overstock
overstock.
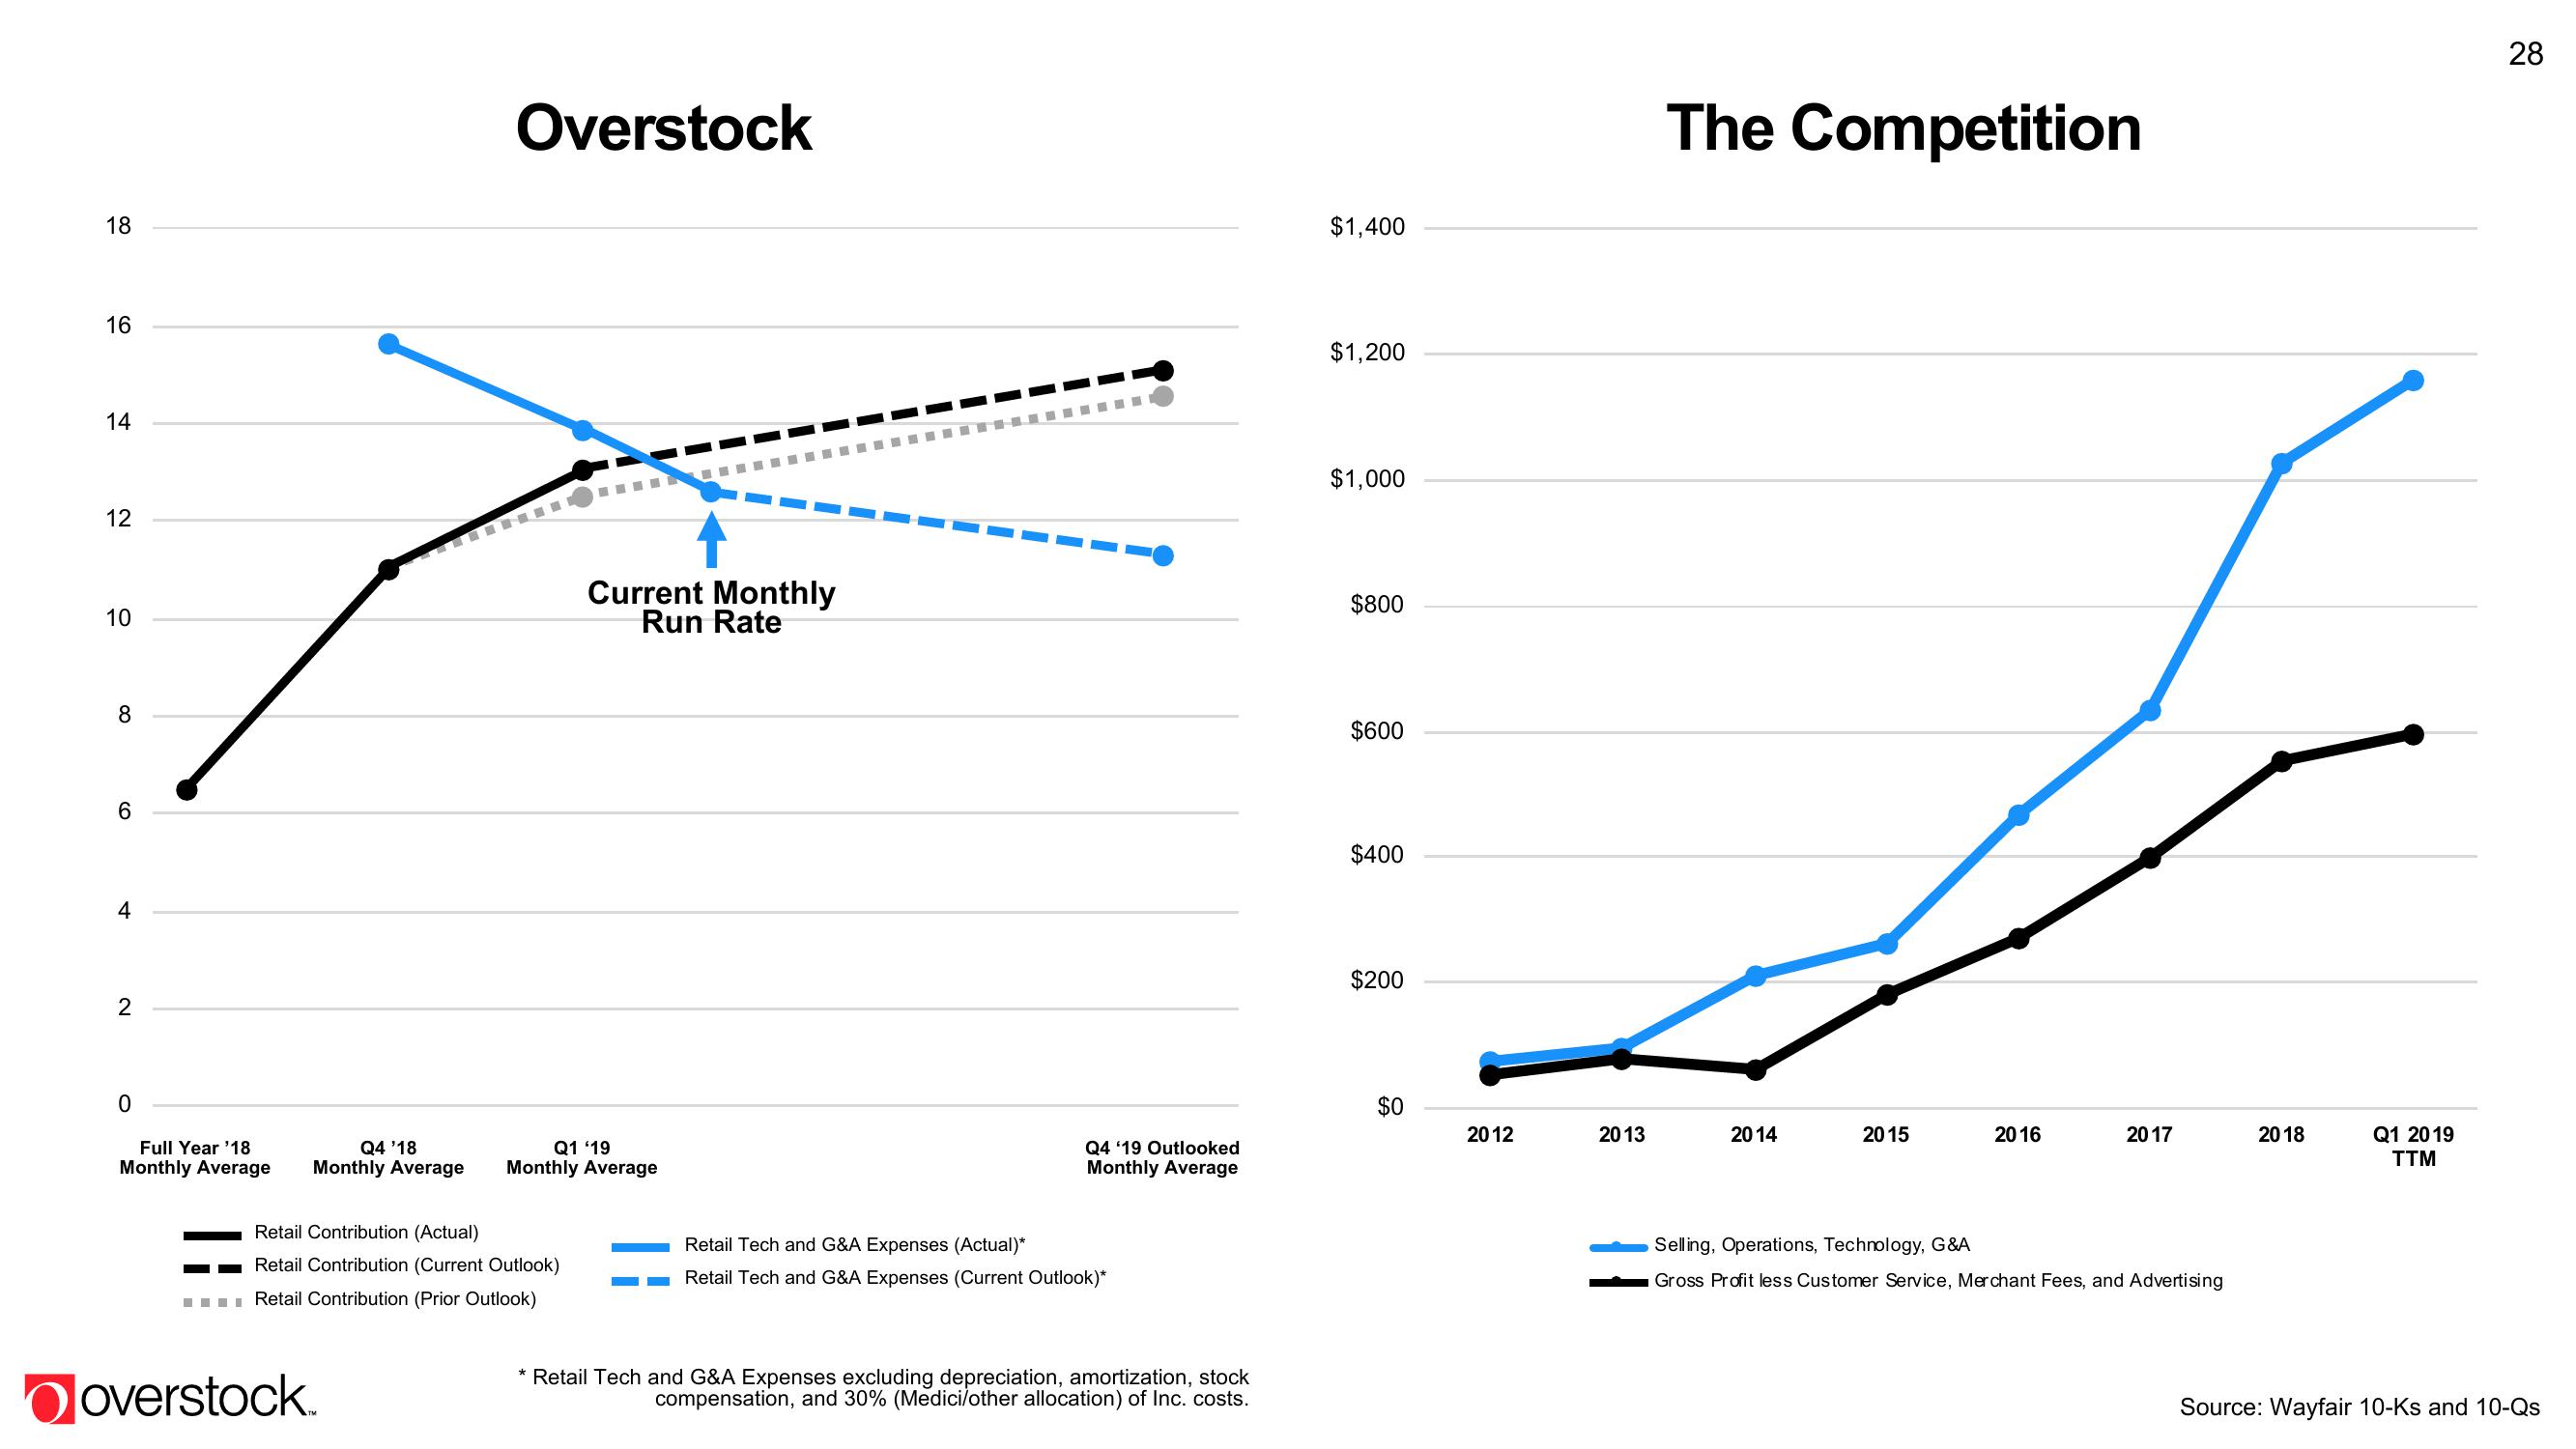
Retail Contribution (Actual)
Retail Contribution (Current Outlook)
■■■■ Retail Contribution (Prior Outlook)
Q1 '19
Monthly Average
‒‒‒‒‒‒‒‒‒
Current Monthly
Run Rate
Q4 '19 Outlooked
Monthly Average
Retail Tech and G&A Expenses (Actual)*
Retail Tech and G&A Expenses (Current Outlook)*
* Retail Tech and G&A Expenses excluding depreciation, amortization, stock
compensation, and 30% (Medici/other allocation) of Inc. costs.
$1,400
$1,200
$1,000
$800
$600
$400
$200
$0
2012
2013
The Competition
2014
2015
2016
2017
Selling, Operations, Technology, G&A
Gross Profit less Customer Service, Merchant Fees, and Advertising
2018
Q1 2019
TTM
28
Source: Wayfair 10-Ks and 10-QsView entire presentation