Solar Industry Update
Energy Storage Installed (MW)
1,800
1,600
1,400
1,200
1,000
800
600
400
200
0
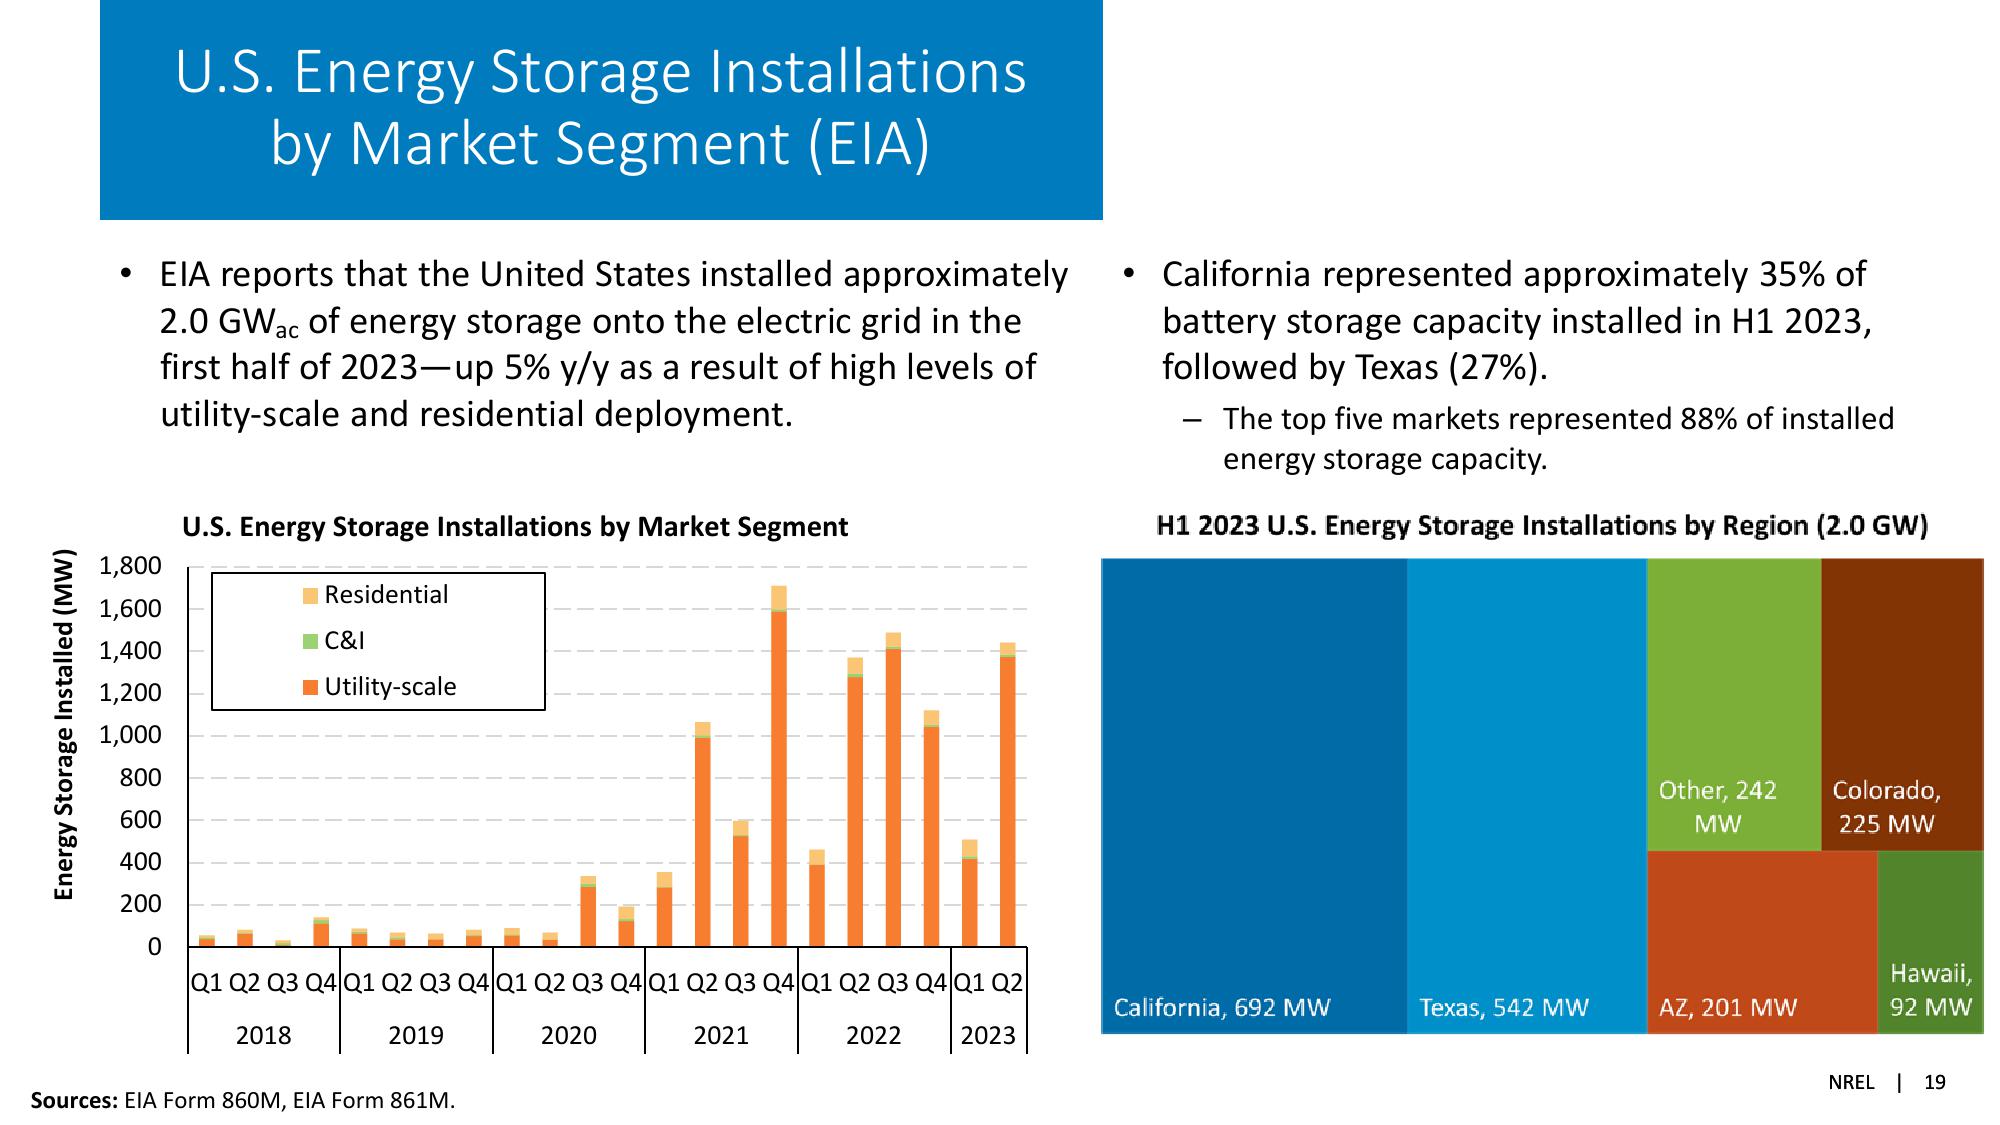
U.S. Energy Storage Installations
by Market Segment (EIA)
EIA reports that the United States installed approximately
2.0 GWac of energy storage onto the electric grid in the
first half of 2023-up 5% y/y as a result of high levels of
utility-scale and residential deployment.
U.S. Energy Storage Installations by Market Segment
Residential
■C&I
Utility-scale
Q1 Q2 Q3 Q4 Q1 Q2 Q3 Q4 Q1 Q2 Q3 Q4 Q1 Q2 Q3 Q4 Q1 Q2 Q3 Q4 Q1 Q2
2018
2019
Sources: EIA Form 860M, EIA Form 861M.
2020
2021
2022
2023
California represented approximately 35% of
battery storage capacity installed in H1 2023,
followed by Texas (27%).
-
The top five markets represented 88% of installed
energy storage capacity.
H1 2023 U.S. Energy Storage Installations by Region (2.0 GW)
Other, 242
MW
Colorado,
225 MW
California, 692 MW
Texas, 542 MW
AZ, 201 MW
Hawaii,
92 MW
NREL 19View entire presentation