Overstock Results Presentation Deck slide image

Overstock Results Presentation Deck

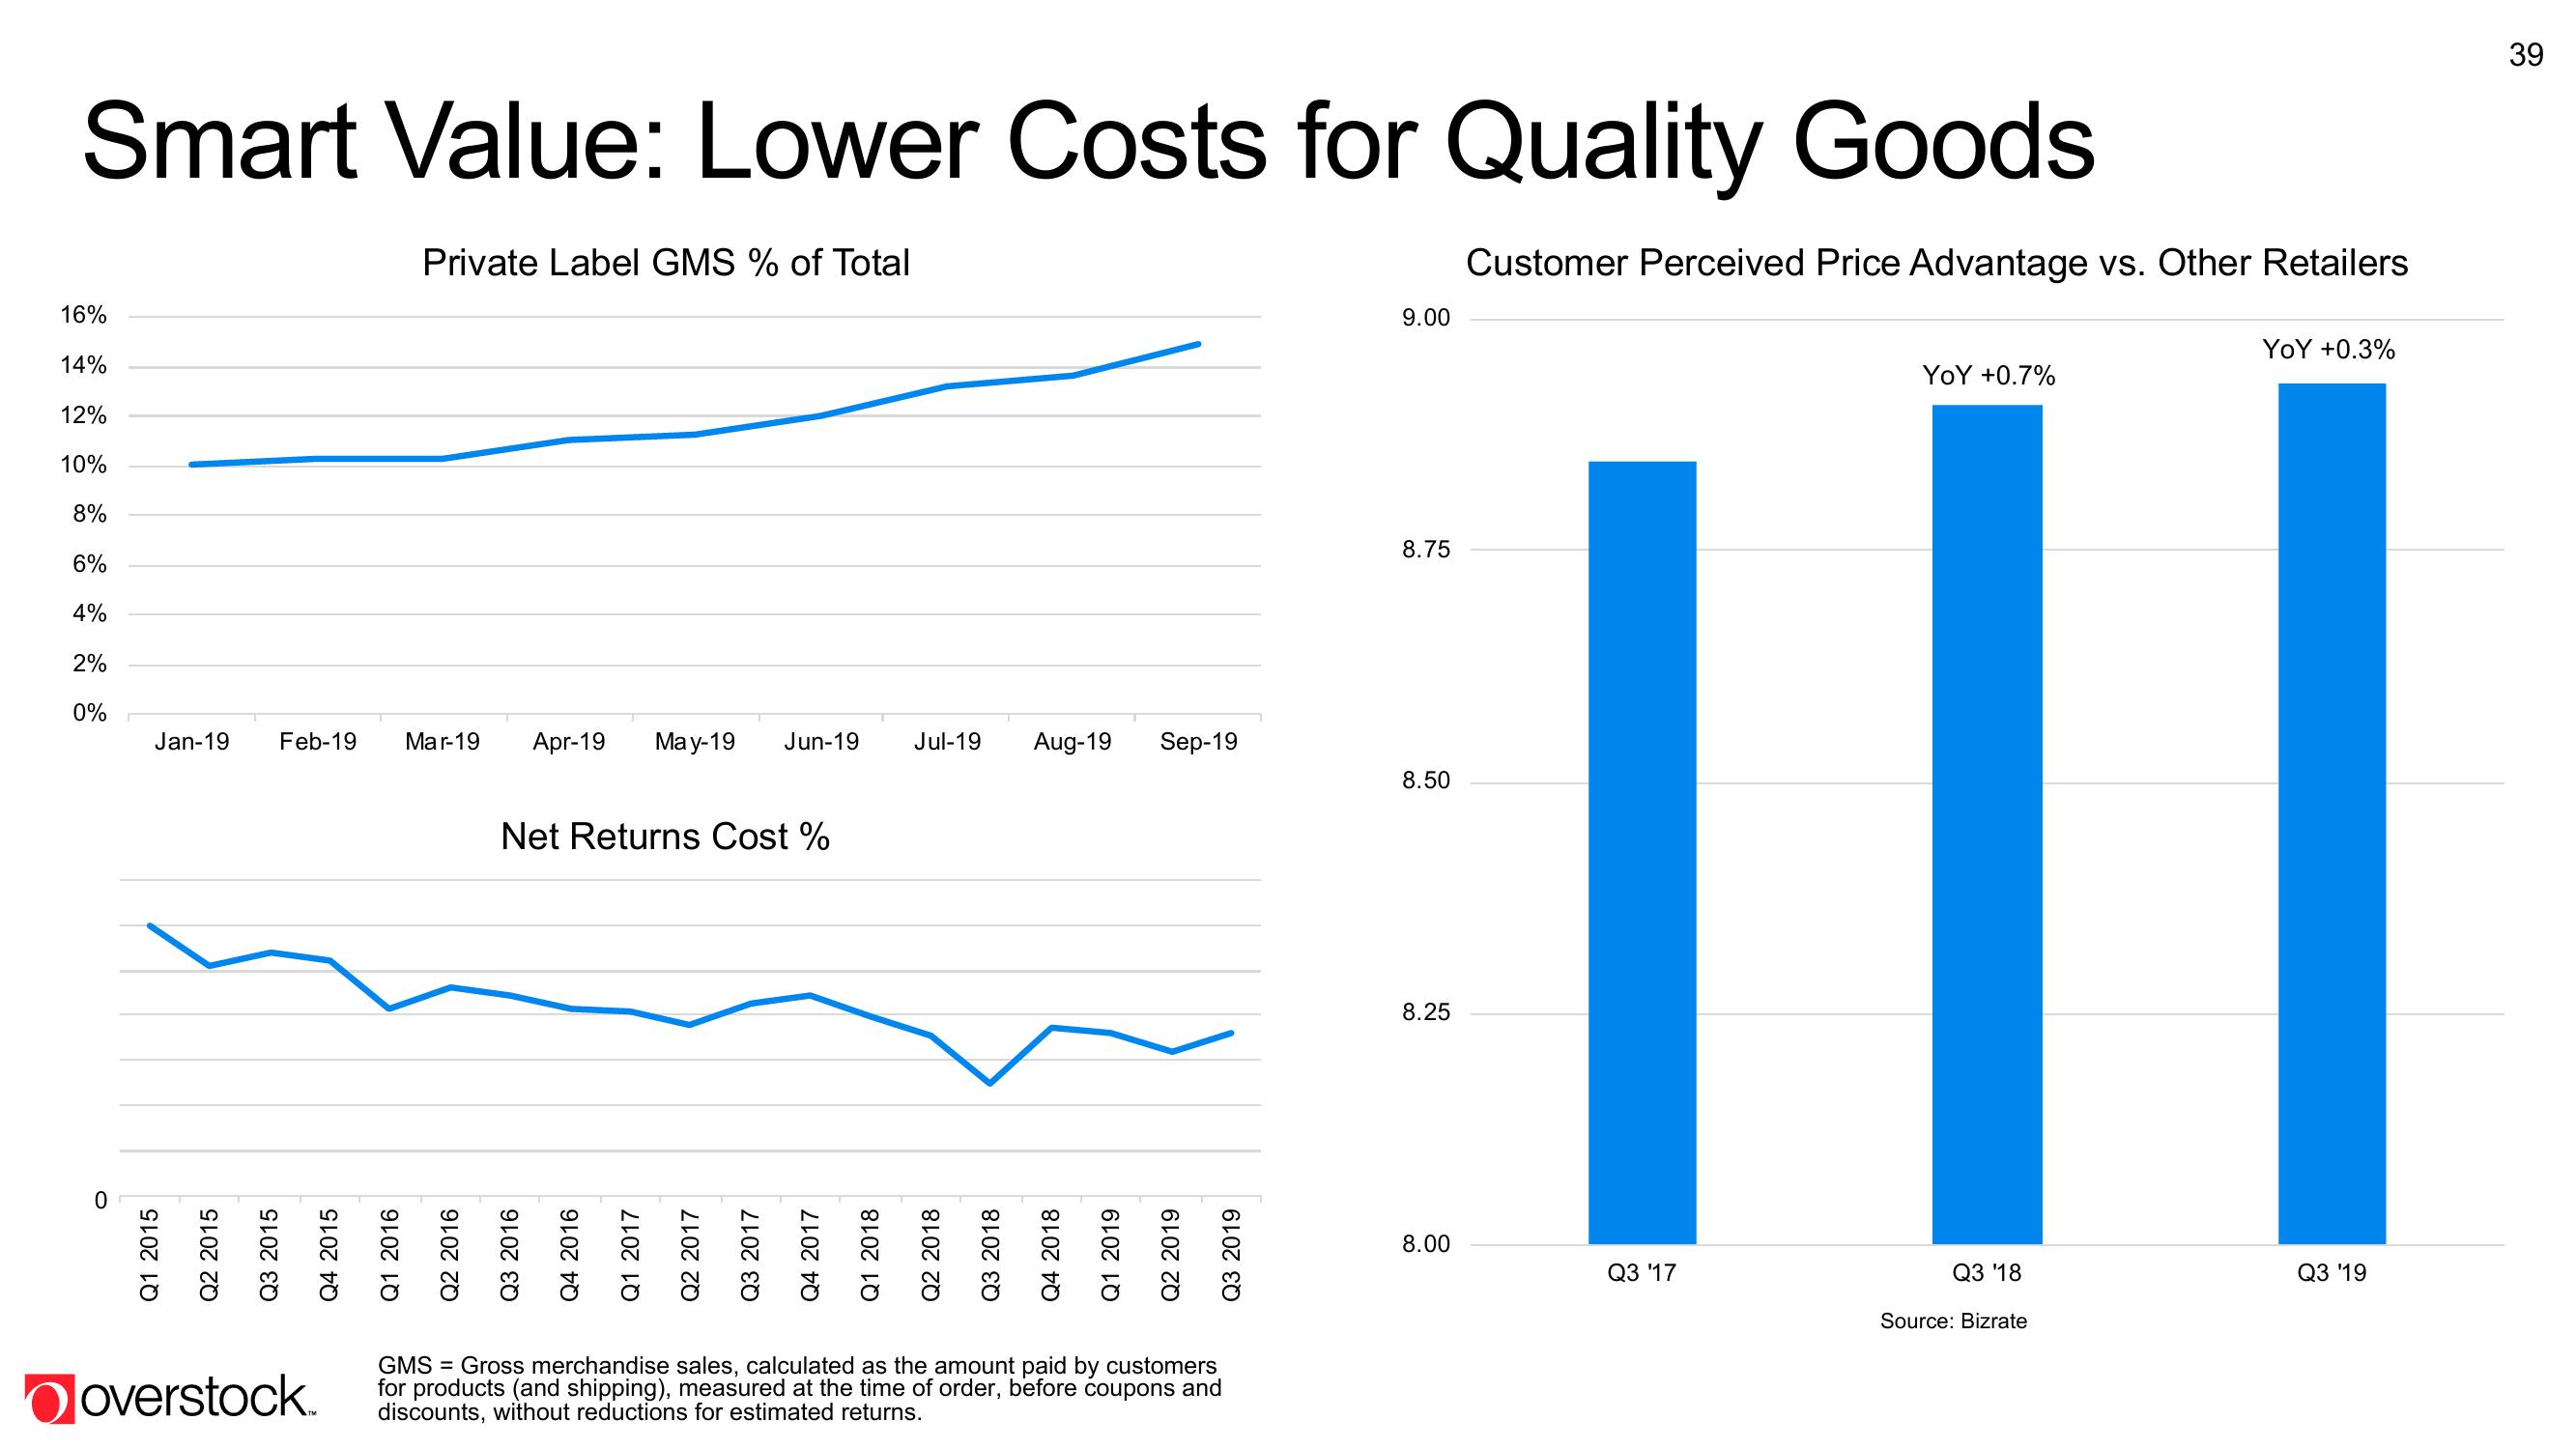
Smart Value: Lower Costs for Quality Goods 16% 14% 12% 10% 8% 6% 4% 2% 0% Jan-19 Feb-19 Mar-19 Apr-19 May-19 Jun-19 Q1 2015 Q2 2015 Q3 2015 Q4 2015 Private Label GMS % of Total Q1 2016 Q2 2016 Net Returns Cost % Q3 2016 Q4 2016 Q1 2017 Q2 2017 Q3 2017 Q4 2017 Q1 2018 Jul-19 Q2 2018 Q3 2018 Aug-19 Sep-19 Q4 2018 Q1 2019 Q2 2019 Q3 2019 GMS = Gross merchandise sales, calculated as the amount paid by customers overstock. for products (and shipping), measured at the time of order, before coupons and discounts, without reductions for estimated returns. 9.00 8.75 8.50 8.25 8.00 Customer Perceived Price Advantage vs. Other Retailers YOY +0.7% Q3 '17 YOY +0.3% ||| Q3 '18 Source: Bizrate Q3 '19 39
View entire presentation