MP Materials Investor Conference Presentation Deck
Rapid
revenue &
earnings growth
1.
2.
■
■
2021
2022
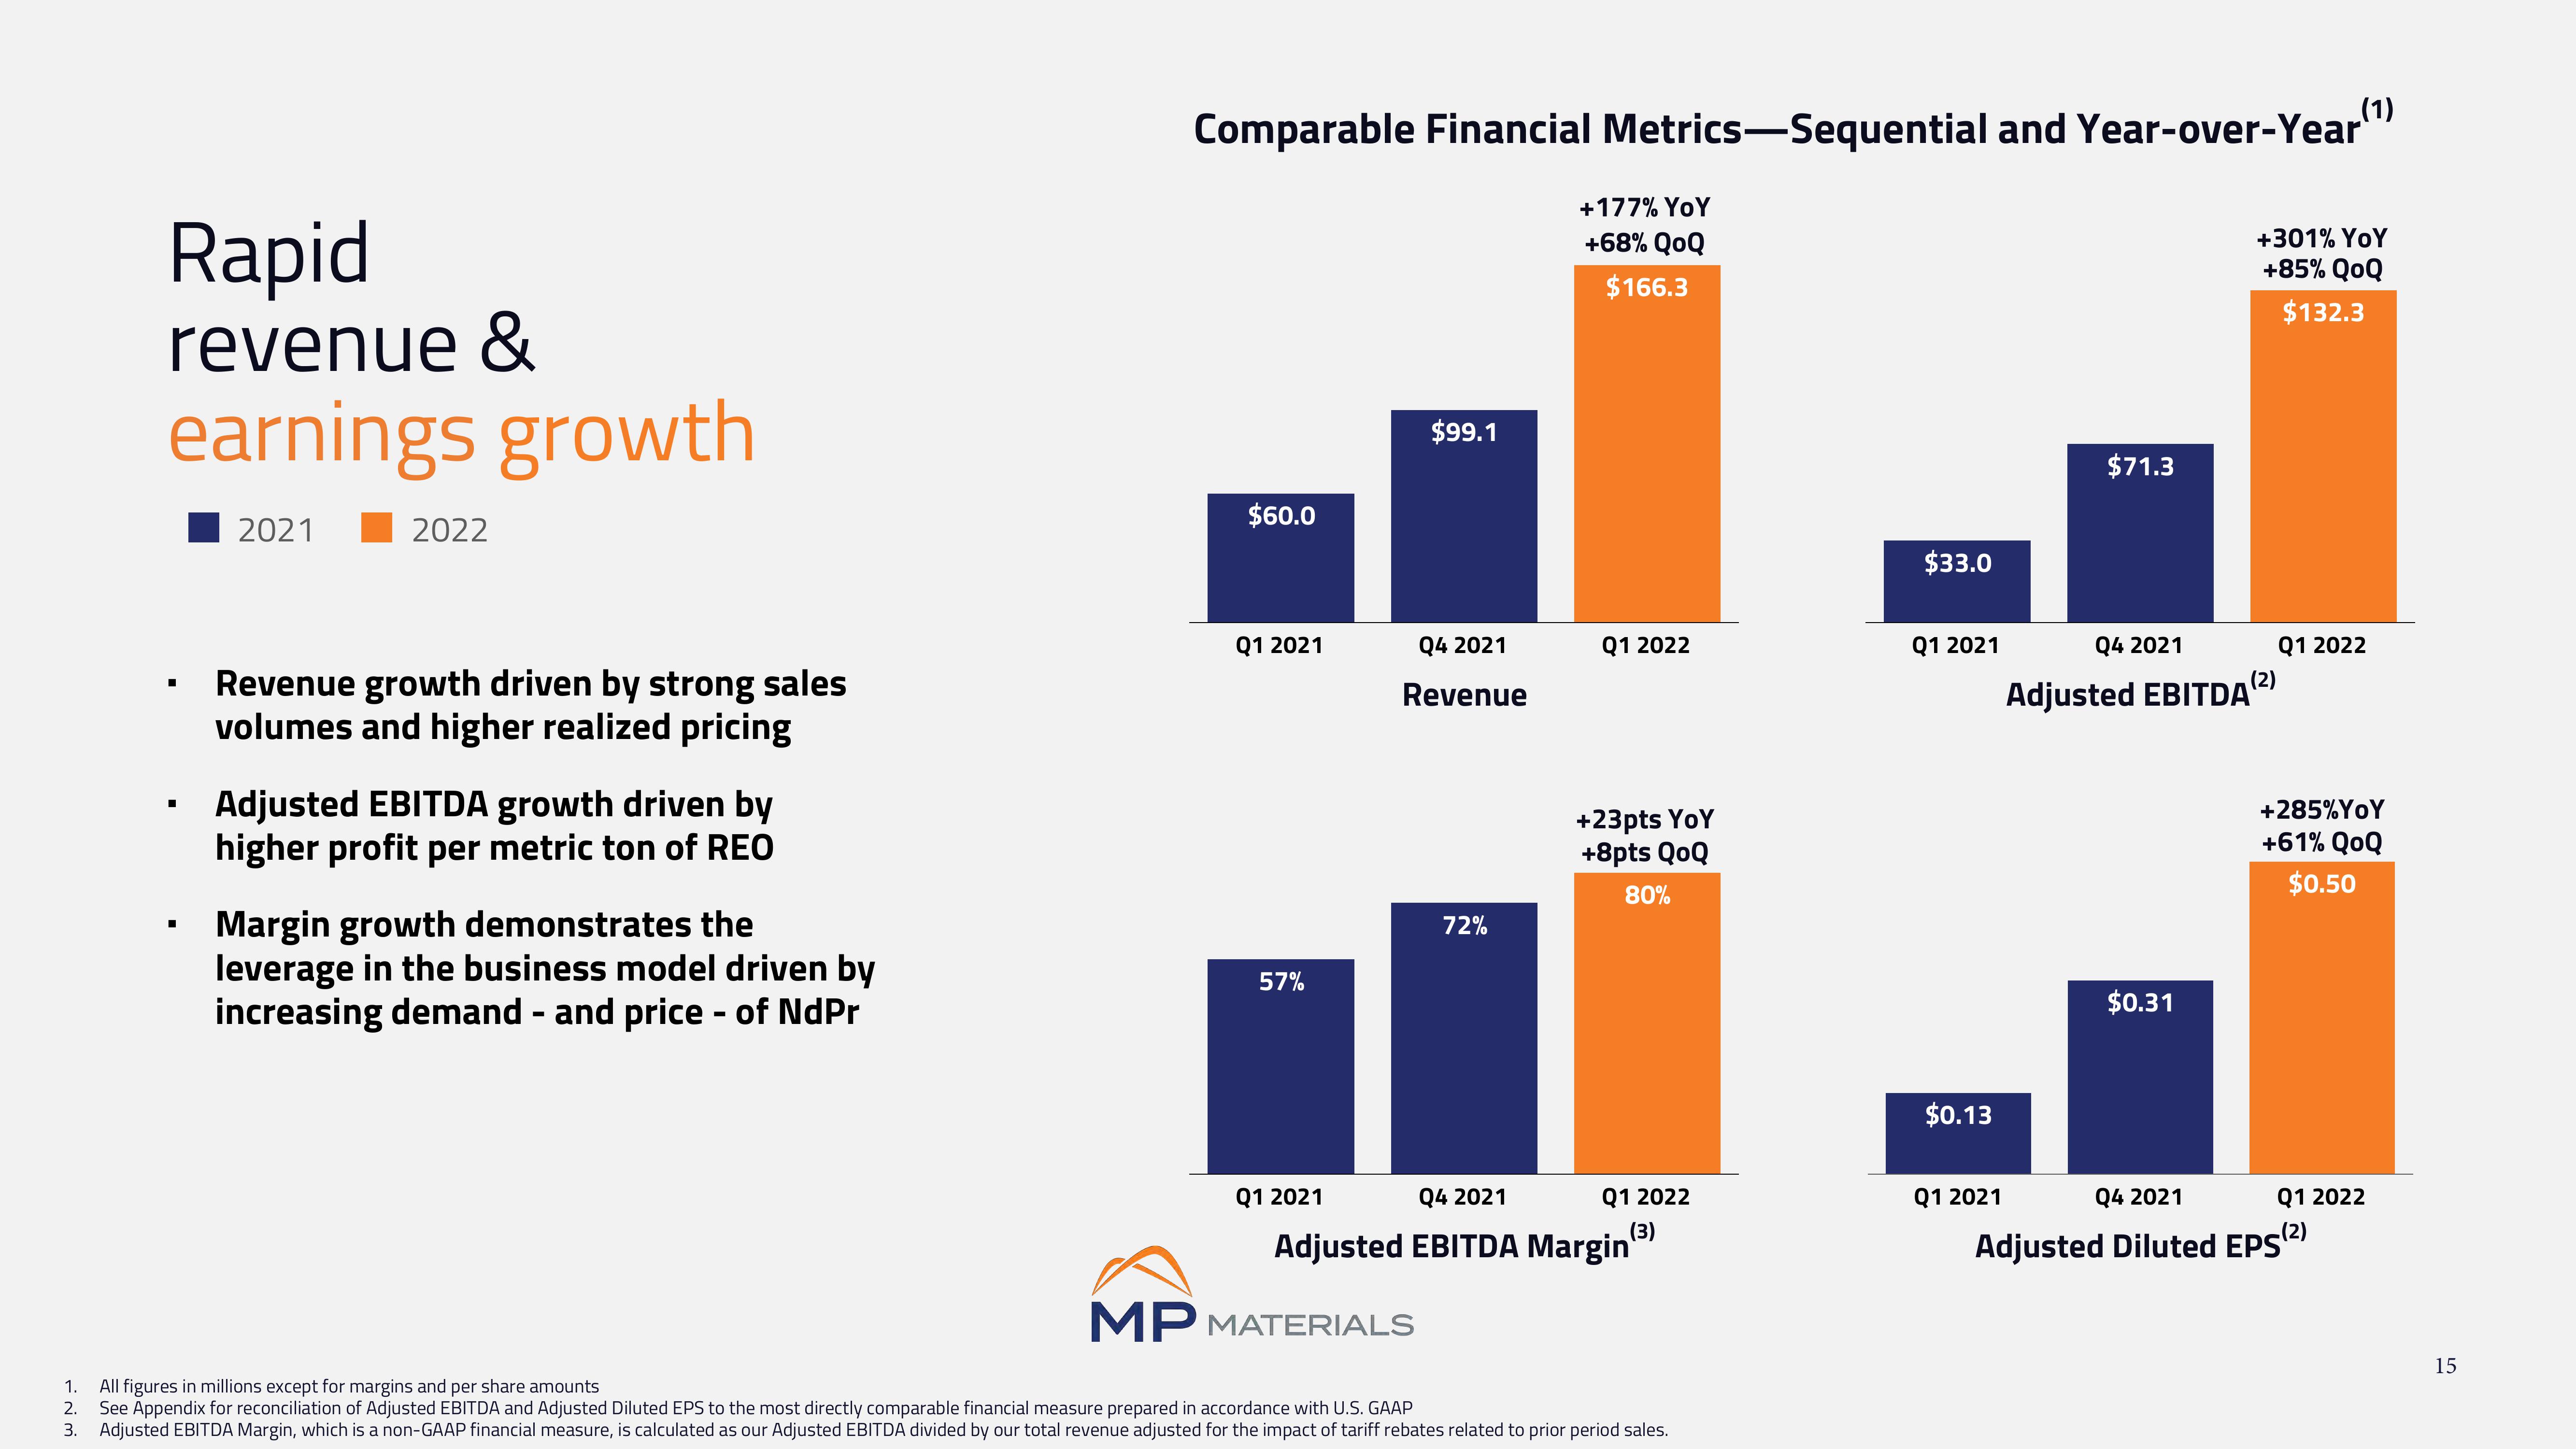
Revenue growth driven by strong sales
volumes and higher realized pricing
Adjusted EBITDA growth driven by
higher profit per metric ton of REO
Margin growth demonstrates the
leverage in the business model driven by
increasing demand - and price - of NdPr
Comparable Financial Metrics-Sequential and Year-over-Year
$60.0
Q1 2021
57%
$99.1
Q4 2021
Revenue
MP MATERIALS
72%
+177% YoY
+68% QOQ
$166.3
Q1 2022
+23pts YoY
+8pts QoQ
80%
Q1 2021
Q4 2021
Q1 2022
Adjusted EBITDA Margin(³)
All figures in millions except for margins and per share amounts
See Appendix for reconciliation of Adjusted EBITDA and Adjusted Diluted EPS to the most directly comparable financial measure prepared in accordance with U.S. GAAP
3. Adjusted EBITDA Margin, which is a non-GAAP financial measure, is calculated as our Adjusted EBITDA divided by our total revenue adjusted for the impact of tariff rebates related to prior period sales.
$33.0
Q1 2021
$0.13
Q1 2021
$71.3
Q4 2021
Adjusted EBITDA (²)
$0.31
(1)
+301% YoY
+85% QOQ
$132.3
Q1 2022
+285% YoY
+61% QOQ
$0.50
Q4 2021
Adjusted Diluted EPS(2)
Q1 2022
15View entire presentation