Twitter Results Presentation Deck
Audience and engagement
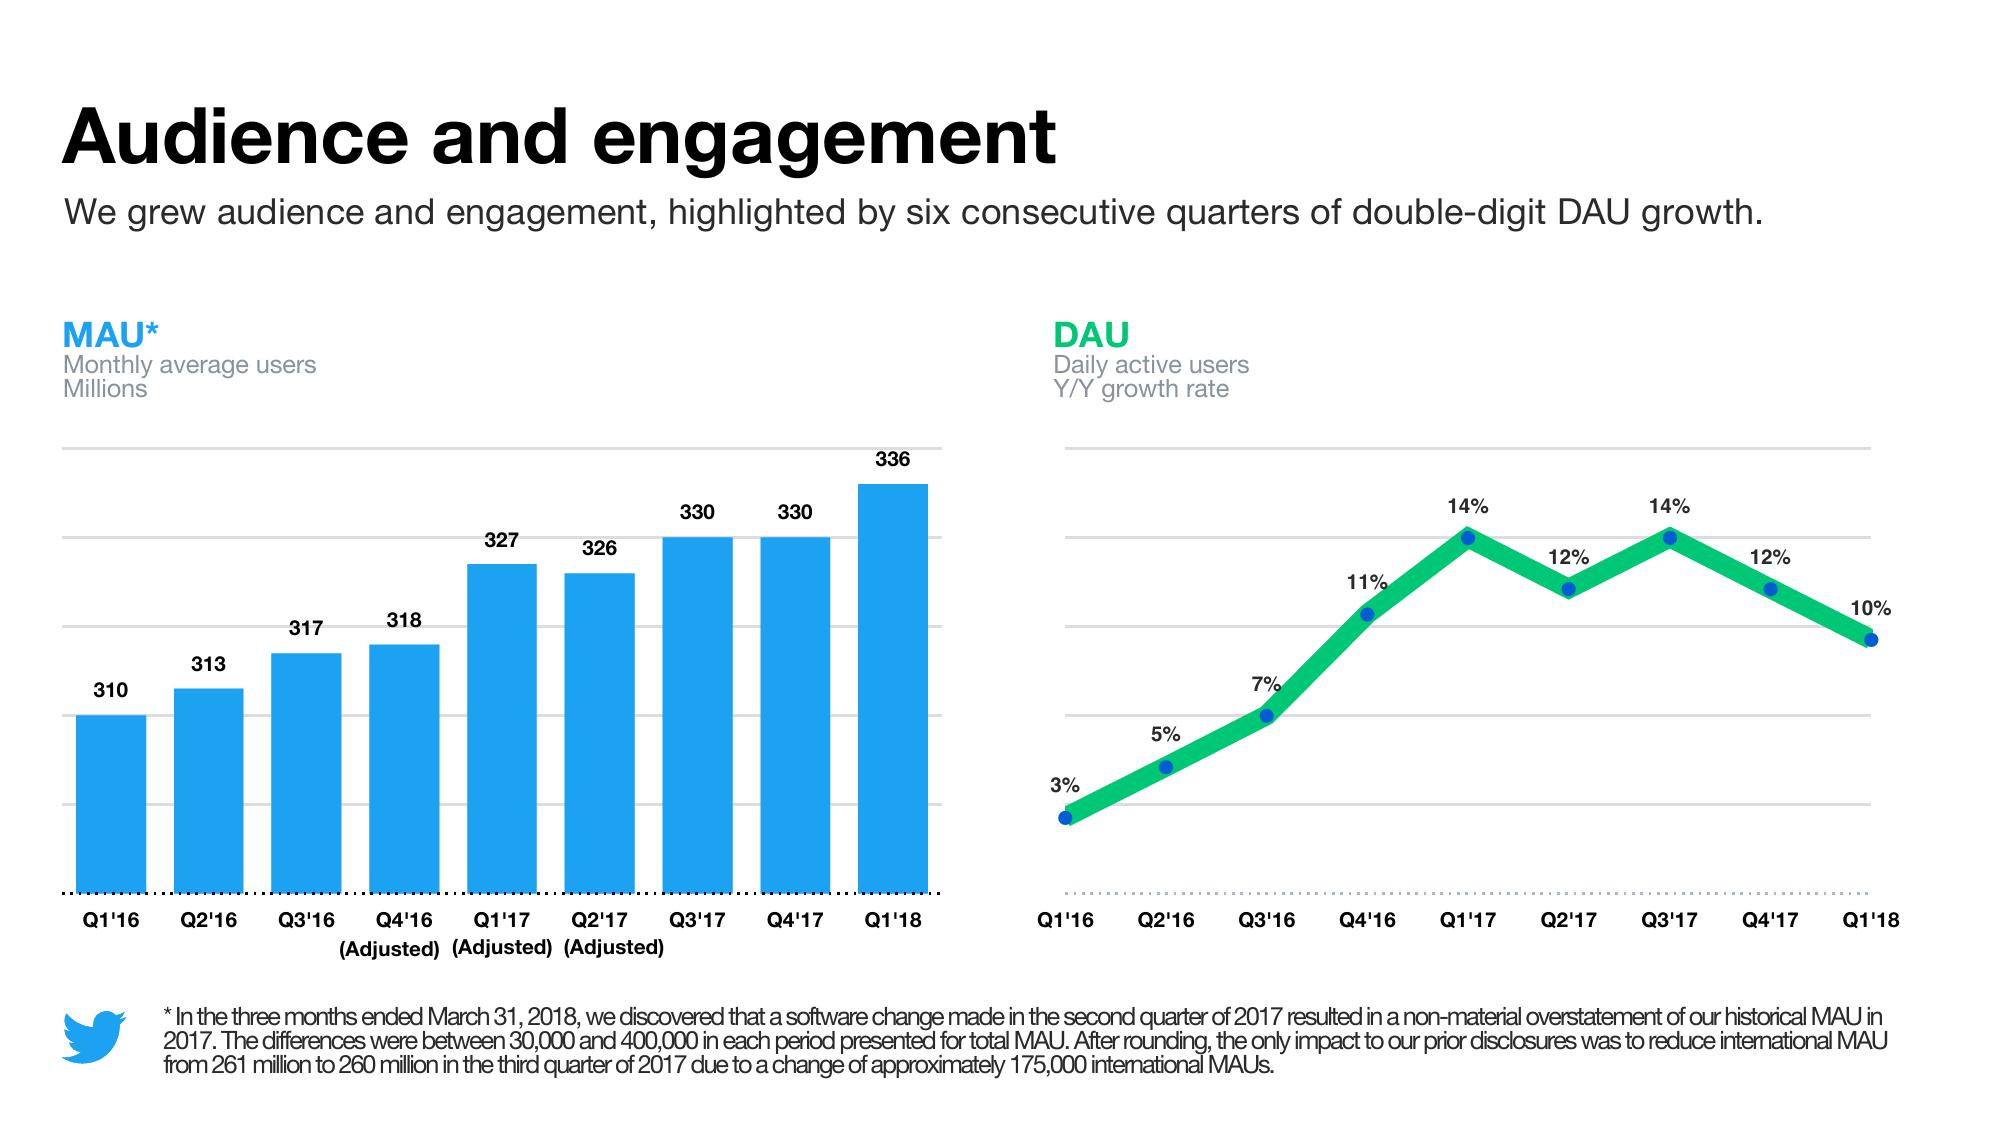
We grew audience and engagement, highlighted by six consecutive quarters of double-digit DAU growth.
MAU*
Monthly average users
Millions
310
Q1'16
313
317
318
327
326
330
330
336
Q2'16 Q3'16 Q4'16 Q1'17 Q2'17 Q3'17 Q4'17 Q1'18
(Adjusted) (Adjusted) (Adjusted)
DAU
Daily active users
Y/Y growth rate
3%
5%
7%
11%
Q1'16 Q2'16 Q3'16 Q4'16
14%
Q1'17
12%
14%
12%
10%
Q2¹17 Q3'17 Q4'17 Q1'18
*In the three months ended March 31, 2018, we discovered that a software change made in the second quarter of 2017 resulted in a non-material overstatement of our historical MAU in
2017. The differences were between 30,000 and 400,000 in each period presented for total MAU. After rounding, the only impact to our prior disclosures was to reduce international MAU
from 261 million to 260 million in the third quarter of 2017 due to a change of approximately 175,000 international MAUS.View entire presentation