Snap Inc Results Presentation Deck slide image

Snap Inc Results Presentation Deck

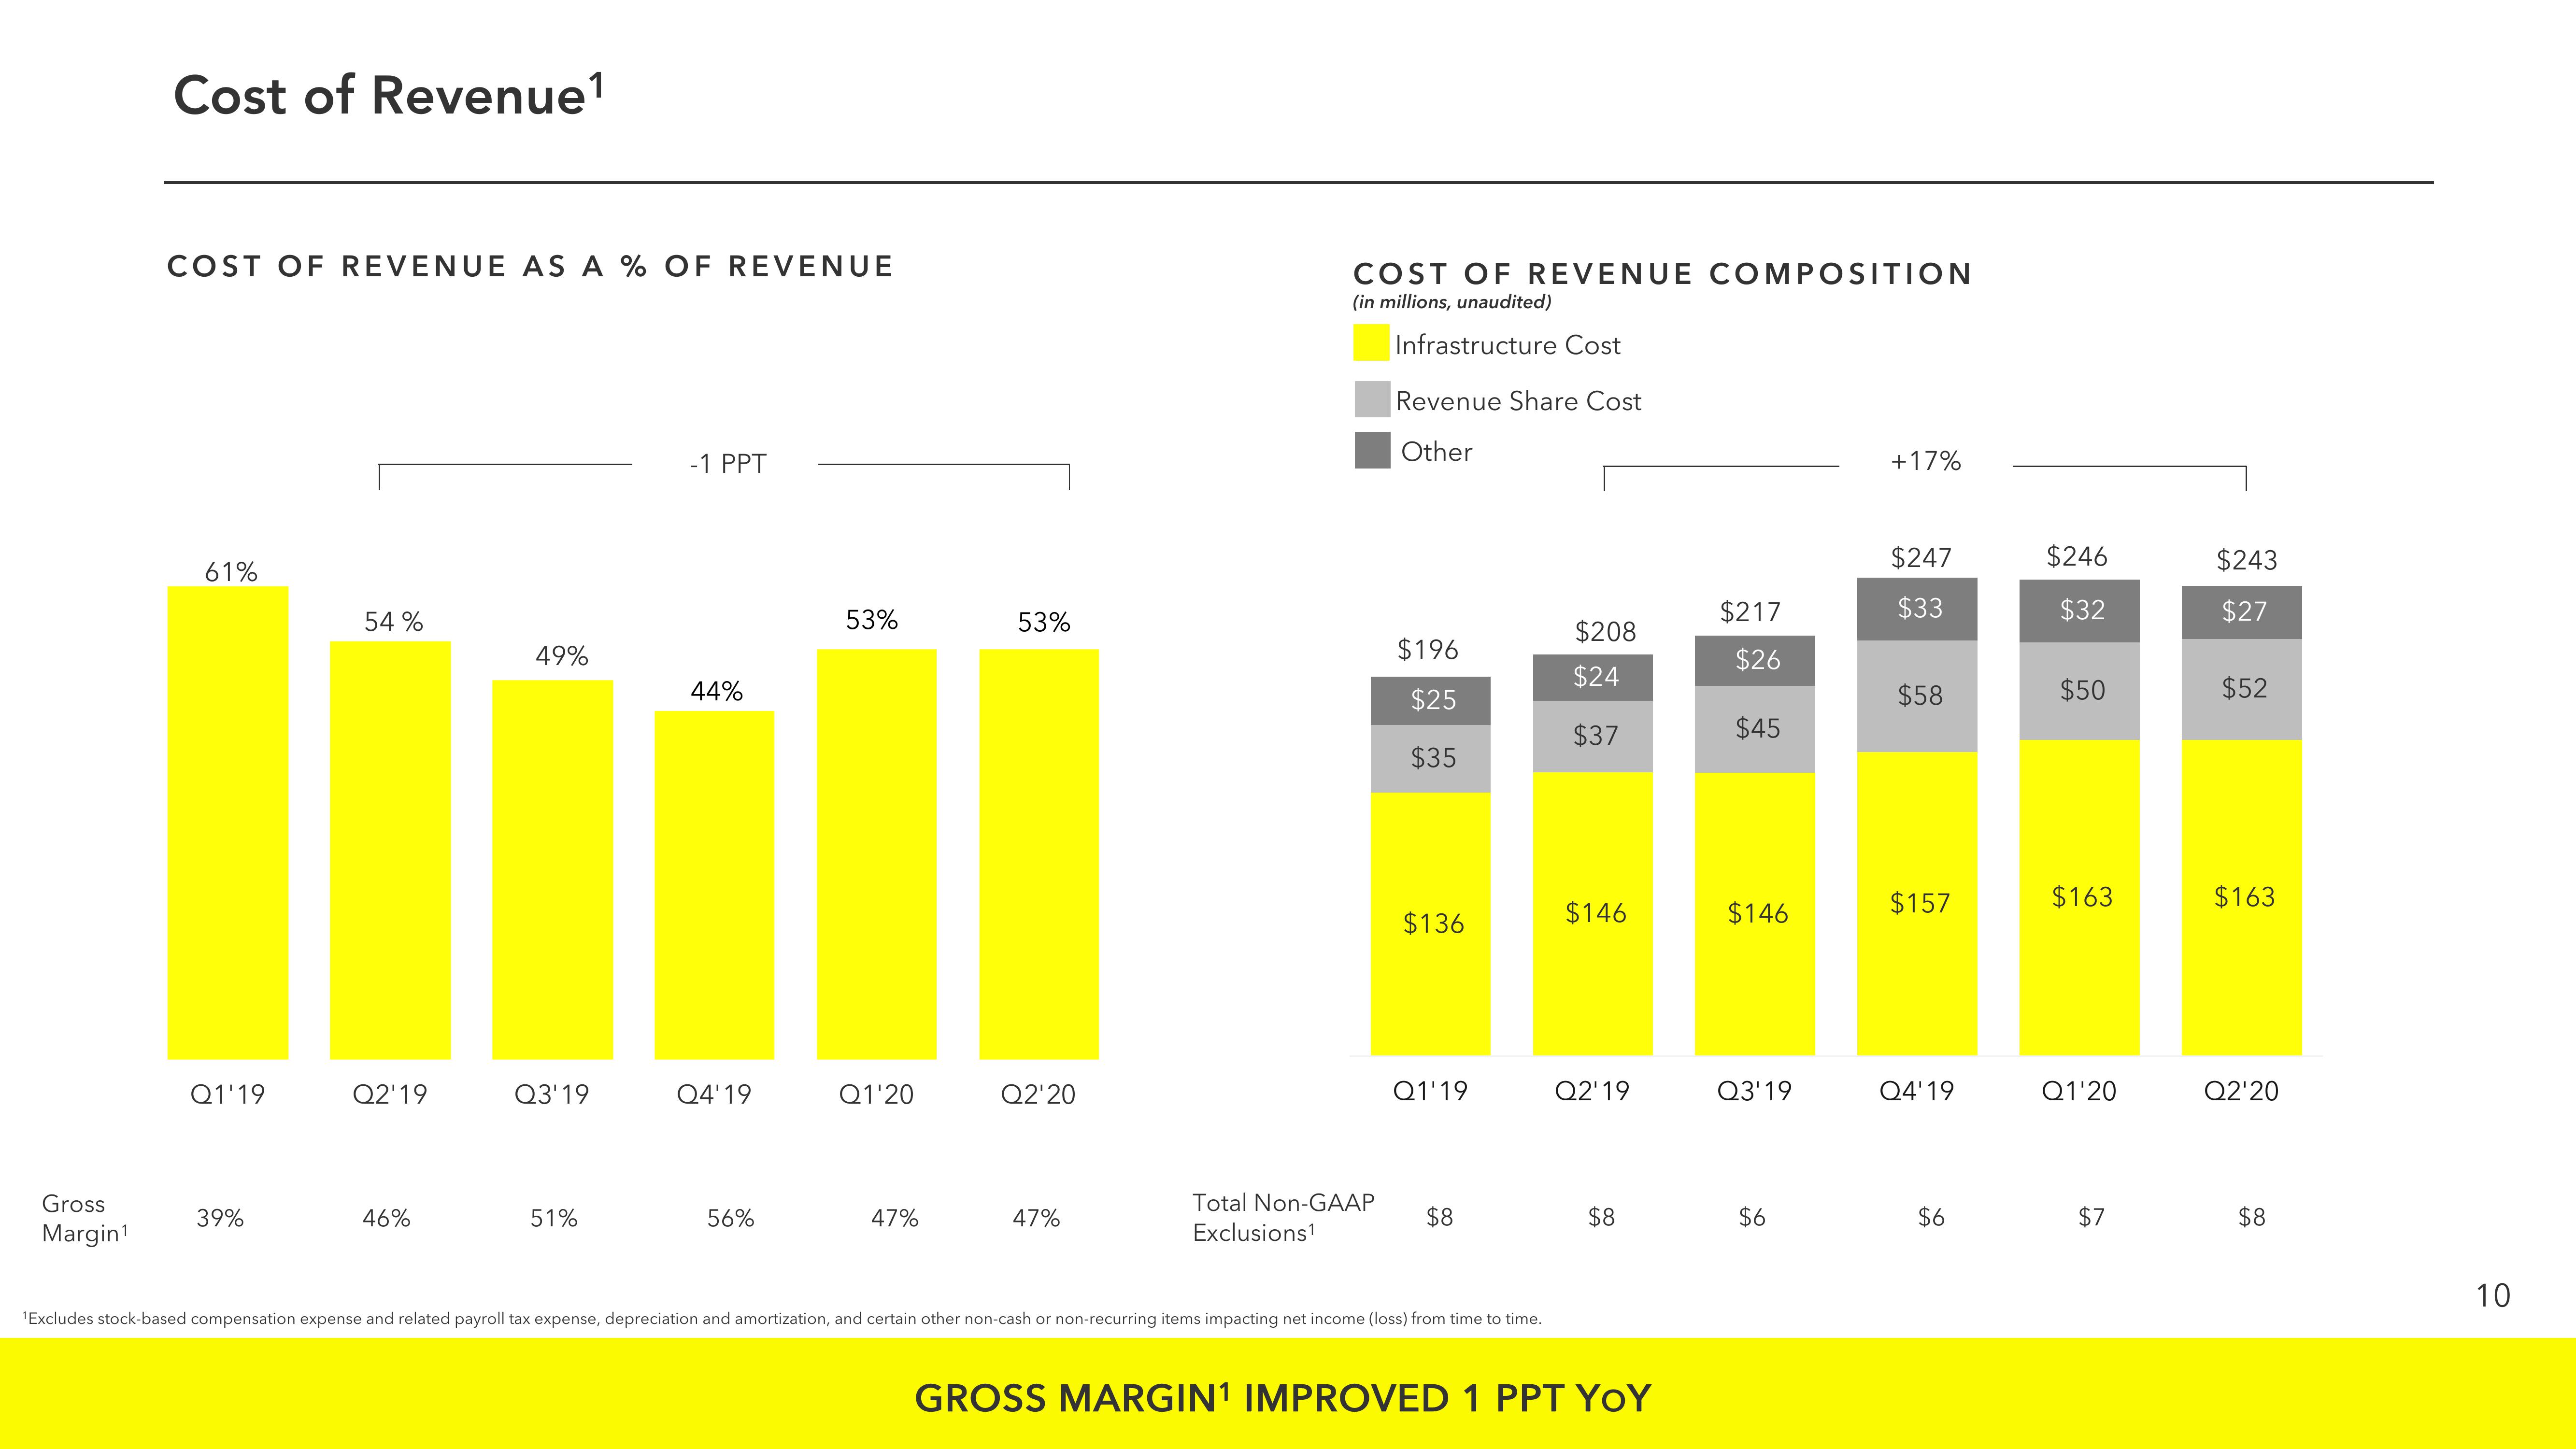
Gross Margin¹ Cost of Revenue¹ COST OF REVENUE AS A % OF REVENUE 61% Q1'19 39% 54% Q2'19 46% 49% Q3'19 51% -1 PPT 44% Q4'19 56% 53% Q1'20 47% 53% Q2'20 47% COST OF REVENUE COMPOSITION (in millions, unaudited) Infrastructure Cost Total Non-GAAP Exclusions¹ Revenue Share Cost Other $196 $25 $35 $136 Q1'19 $8 ¹Excludes stock-based compensation expense and related payroll tax expense, depreciation and amortization, and certain other non-cash or non-recurring items impacting net income (loss) from time to time. $208 $24 $37 $146 Q2'19 $8 GROSS MARGIN¹ IMPROVED 1 PPT YOY $217 $26 $45 $146 Q3'19 $6 +17% $247 $33 $58 $157 Q4'19 $6 $246 $32 $50 $163 Q1'20 $7 $243 $27 $52 $163 Q2'20 $8 10
View entire presentation