Uber Results Presentation Deck
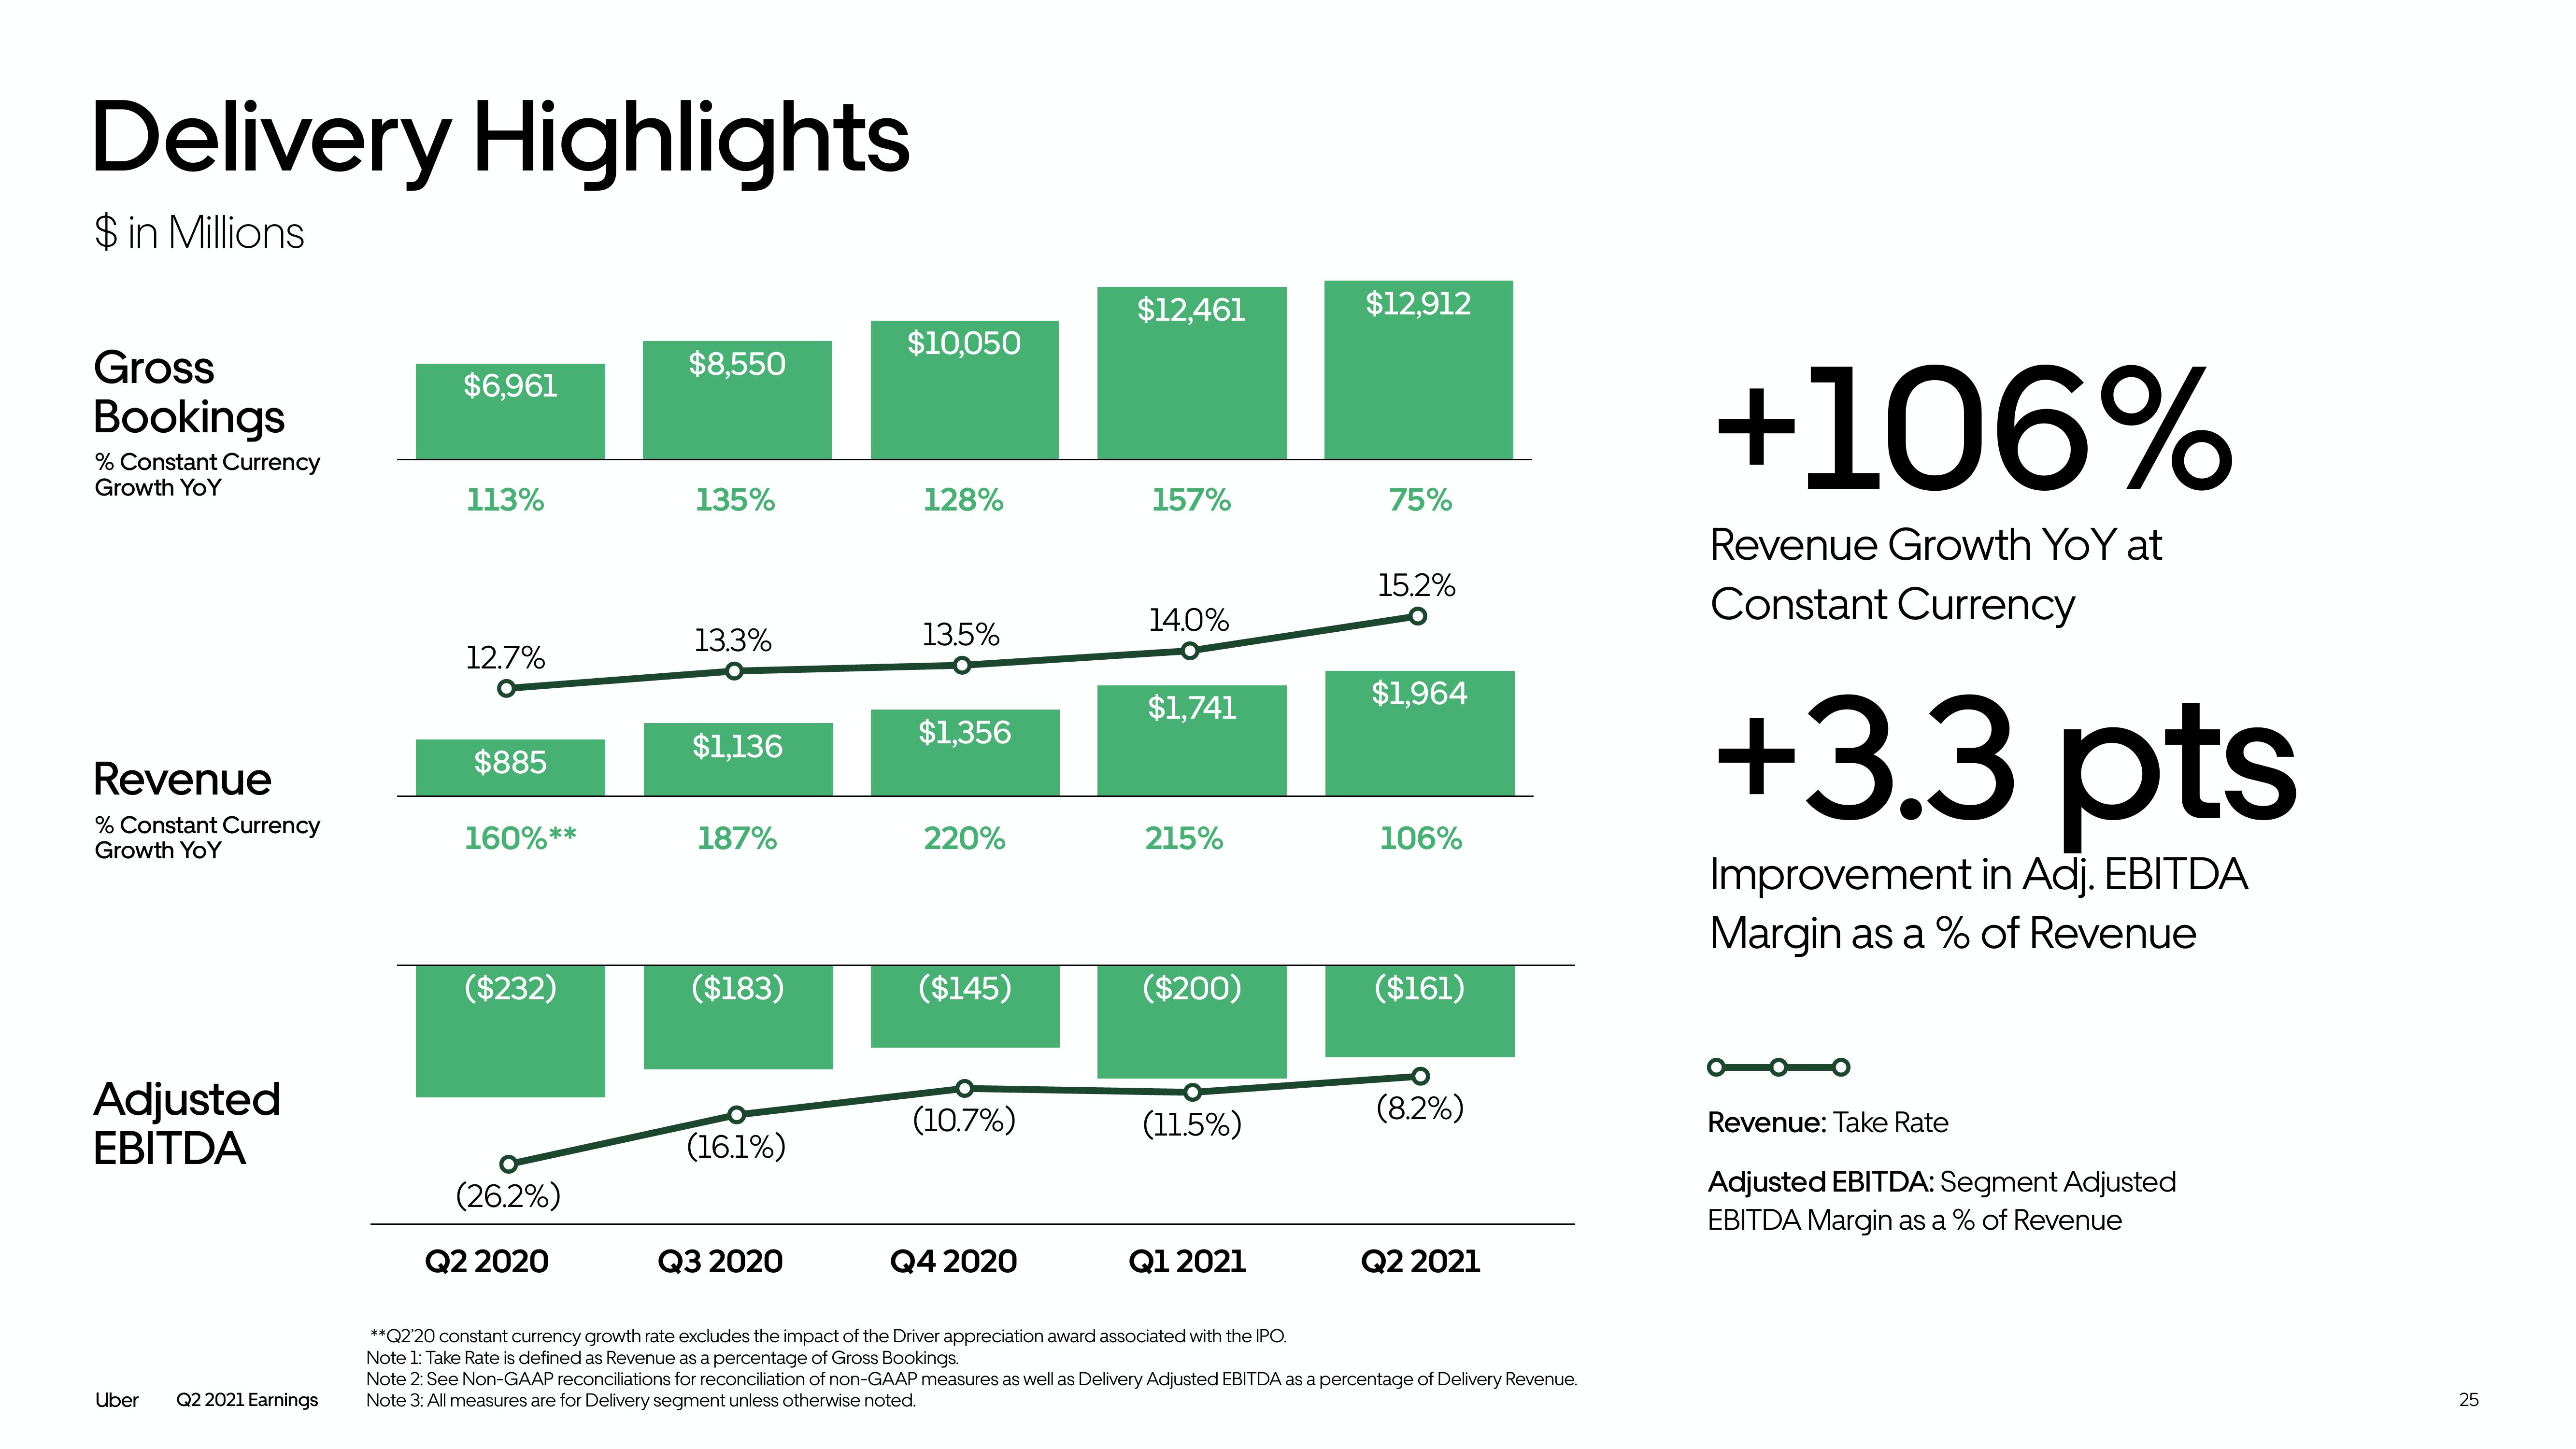
Delivery Highlights
$ in Millions
Gross
Bookings
% Constant Currency
Growth YoY
Revenue
% Constant Currency
Growth YoY
Adjusted
EBITDA
Uber
Q2 2021 Earnings
$6,961
113%
12.7%
$885
160%**
($232)
(26.2%)
Q2 2020
$8,550
135%
13.3%
$1,136
187%
($183)
(16.1%)
Q3 2020
$10,050
128%
13.5%
$1,356
220%
($145)
(10.7%)
Q4 2020
$12,461
157%
14.0%
$1,741
215%
($200)
(11.5%)
Q1 2021
$12,912
75%
15.2%
$1,964
106%
($161)
(8.2%)
Q2 2021
**Q2'20 constant currency growth rate excludes the impact of the Driver appreciation award associated with the IPO.
Note 1: Take Rate is defined as Revenue as a percentage of Gross Bookings.
Note 2: See Non-GAAP reconciliations for reconciliation of non-GAAP measures as well as Delivery Adjusted EBITDA as a percentage of Delivery Revenue.
Note 3: All measures are for Delivery segment unless otherwise noted.
+106%
Revenue Growth YoY at
Constant Currency
+3.3 pts
Improvement in Adj. EBITDA
Margin as a % of Revenue
Revenue: Take Rate
Adjusted EBITDA: Segment Adjusted
EBITDA Margin as a % of Revenue
25View entire presentation