Nexters SPAC Presentation Deck
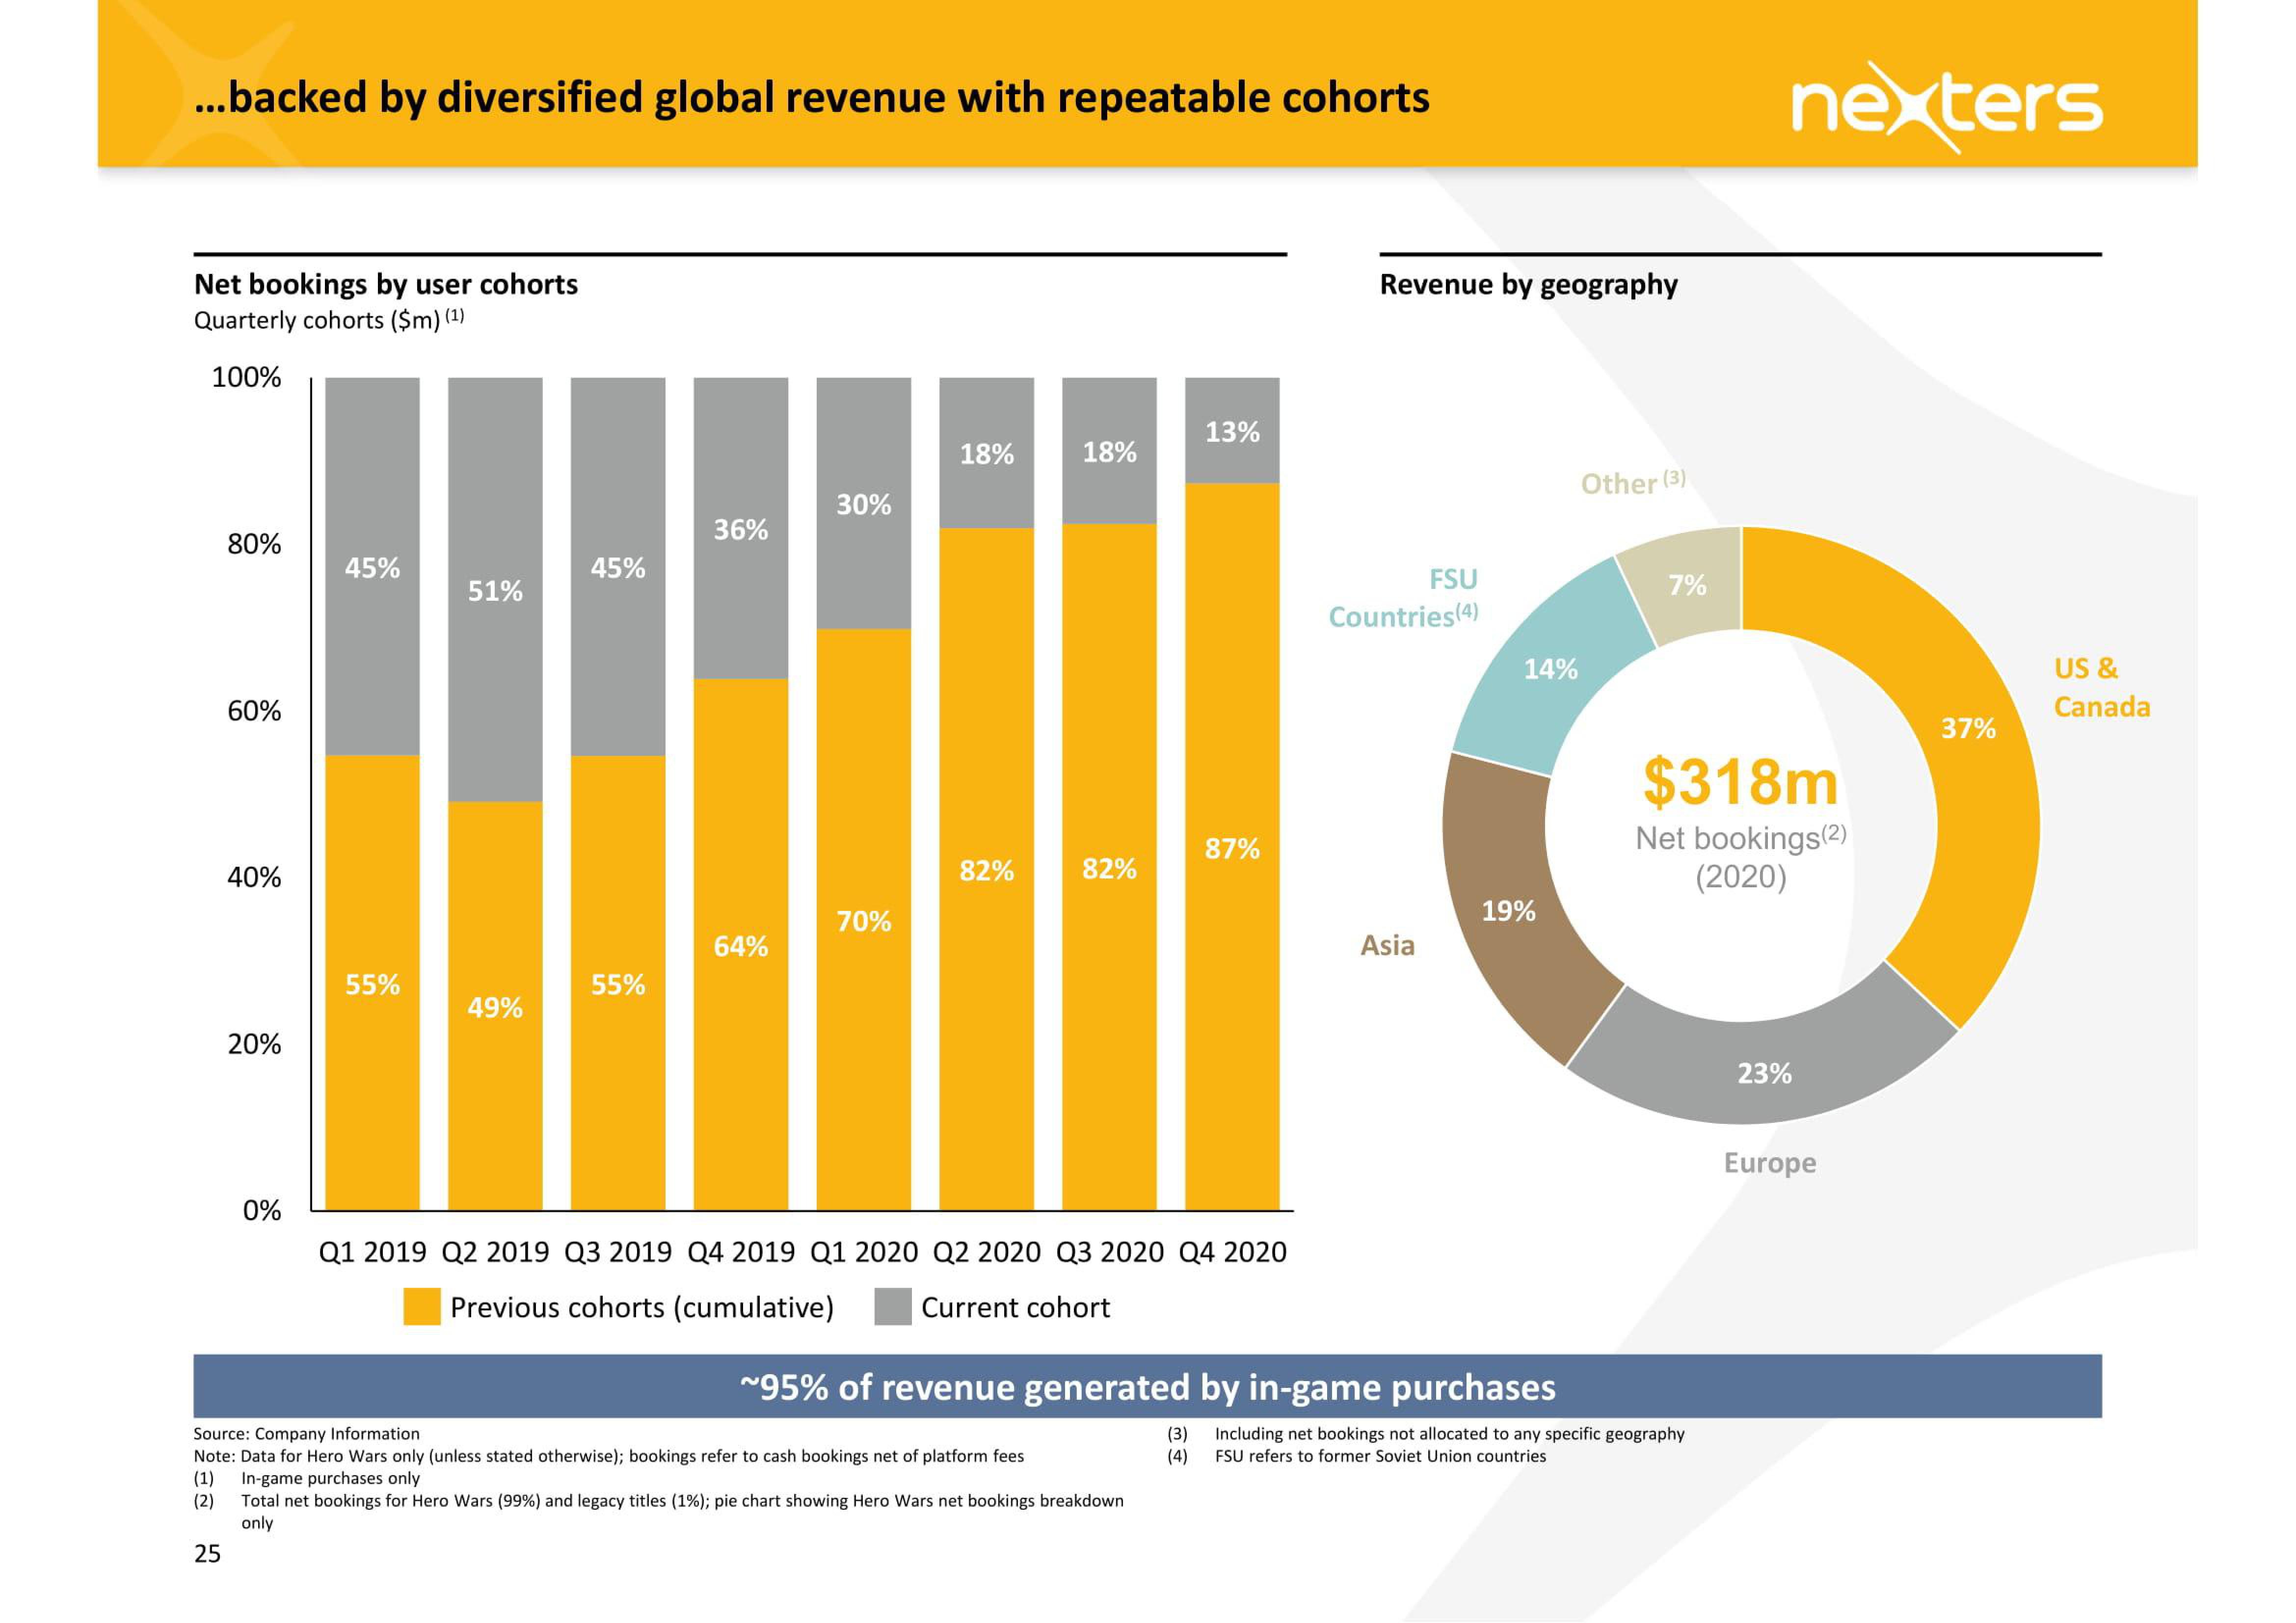
...backed by diversified global revenue with repeatable cohorts
Net bookings by user cohorts
Quarterly cohorts ($m) (¹)
100%
80%
25
60%
40%
20%
0%
45%
55%
51%
49%
45%
55%
36%
64%
30%
70%
18%
82%
18%
Source: Company Information
Note: Data for Hero Wars only (unless stated otherwise); bookings refer to cash bookings net of platform fees
(1) In-game purchases only
(2)
82%
Q1 2019 Q2 2019 Q3 2019 Q4 2019 Q1 2020 Q2 2020 Q3 2020 Q4 2020
Previous cohorts (cumulative)
Current cohort
13%
Total net bookings for Hero Wars (99%) and legacy titles (1%); pie chart showing Hero Wars net bookings breakdown
only
87%
(3)
(4)
Revenue by geography
FSU
Countries (4)
Asia
~95% of revenue generated by in-game purchases
14%
19%
Other (3)
7%
nexters
$318m
Net bookings (2)
(2020)
Including net bookings not allocated to any specific geography
FSU refers to former Soviet Union countries
23%
Europe
37%
US &
CanadaView entire presentation