dLocal Results Presentation Deck
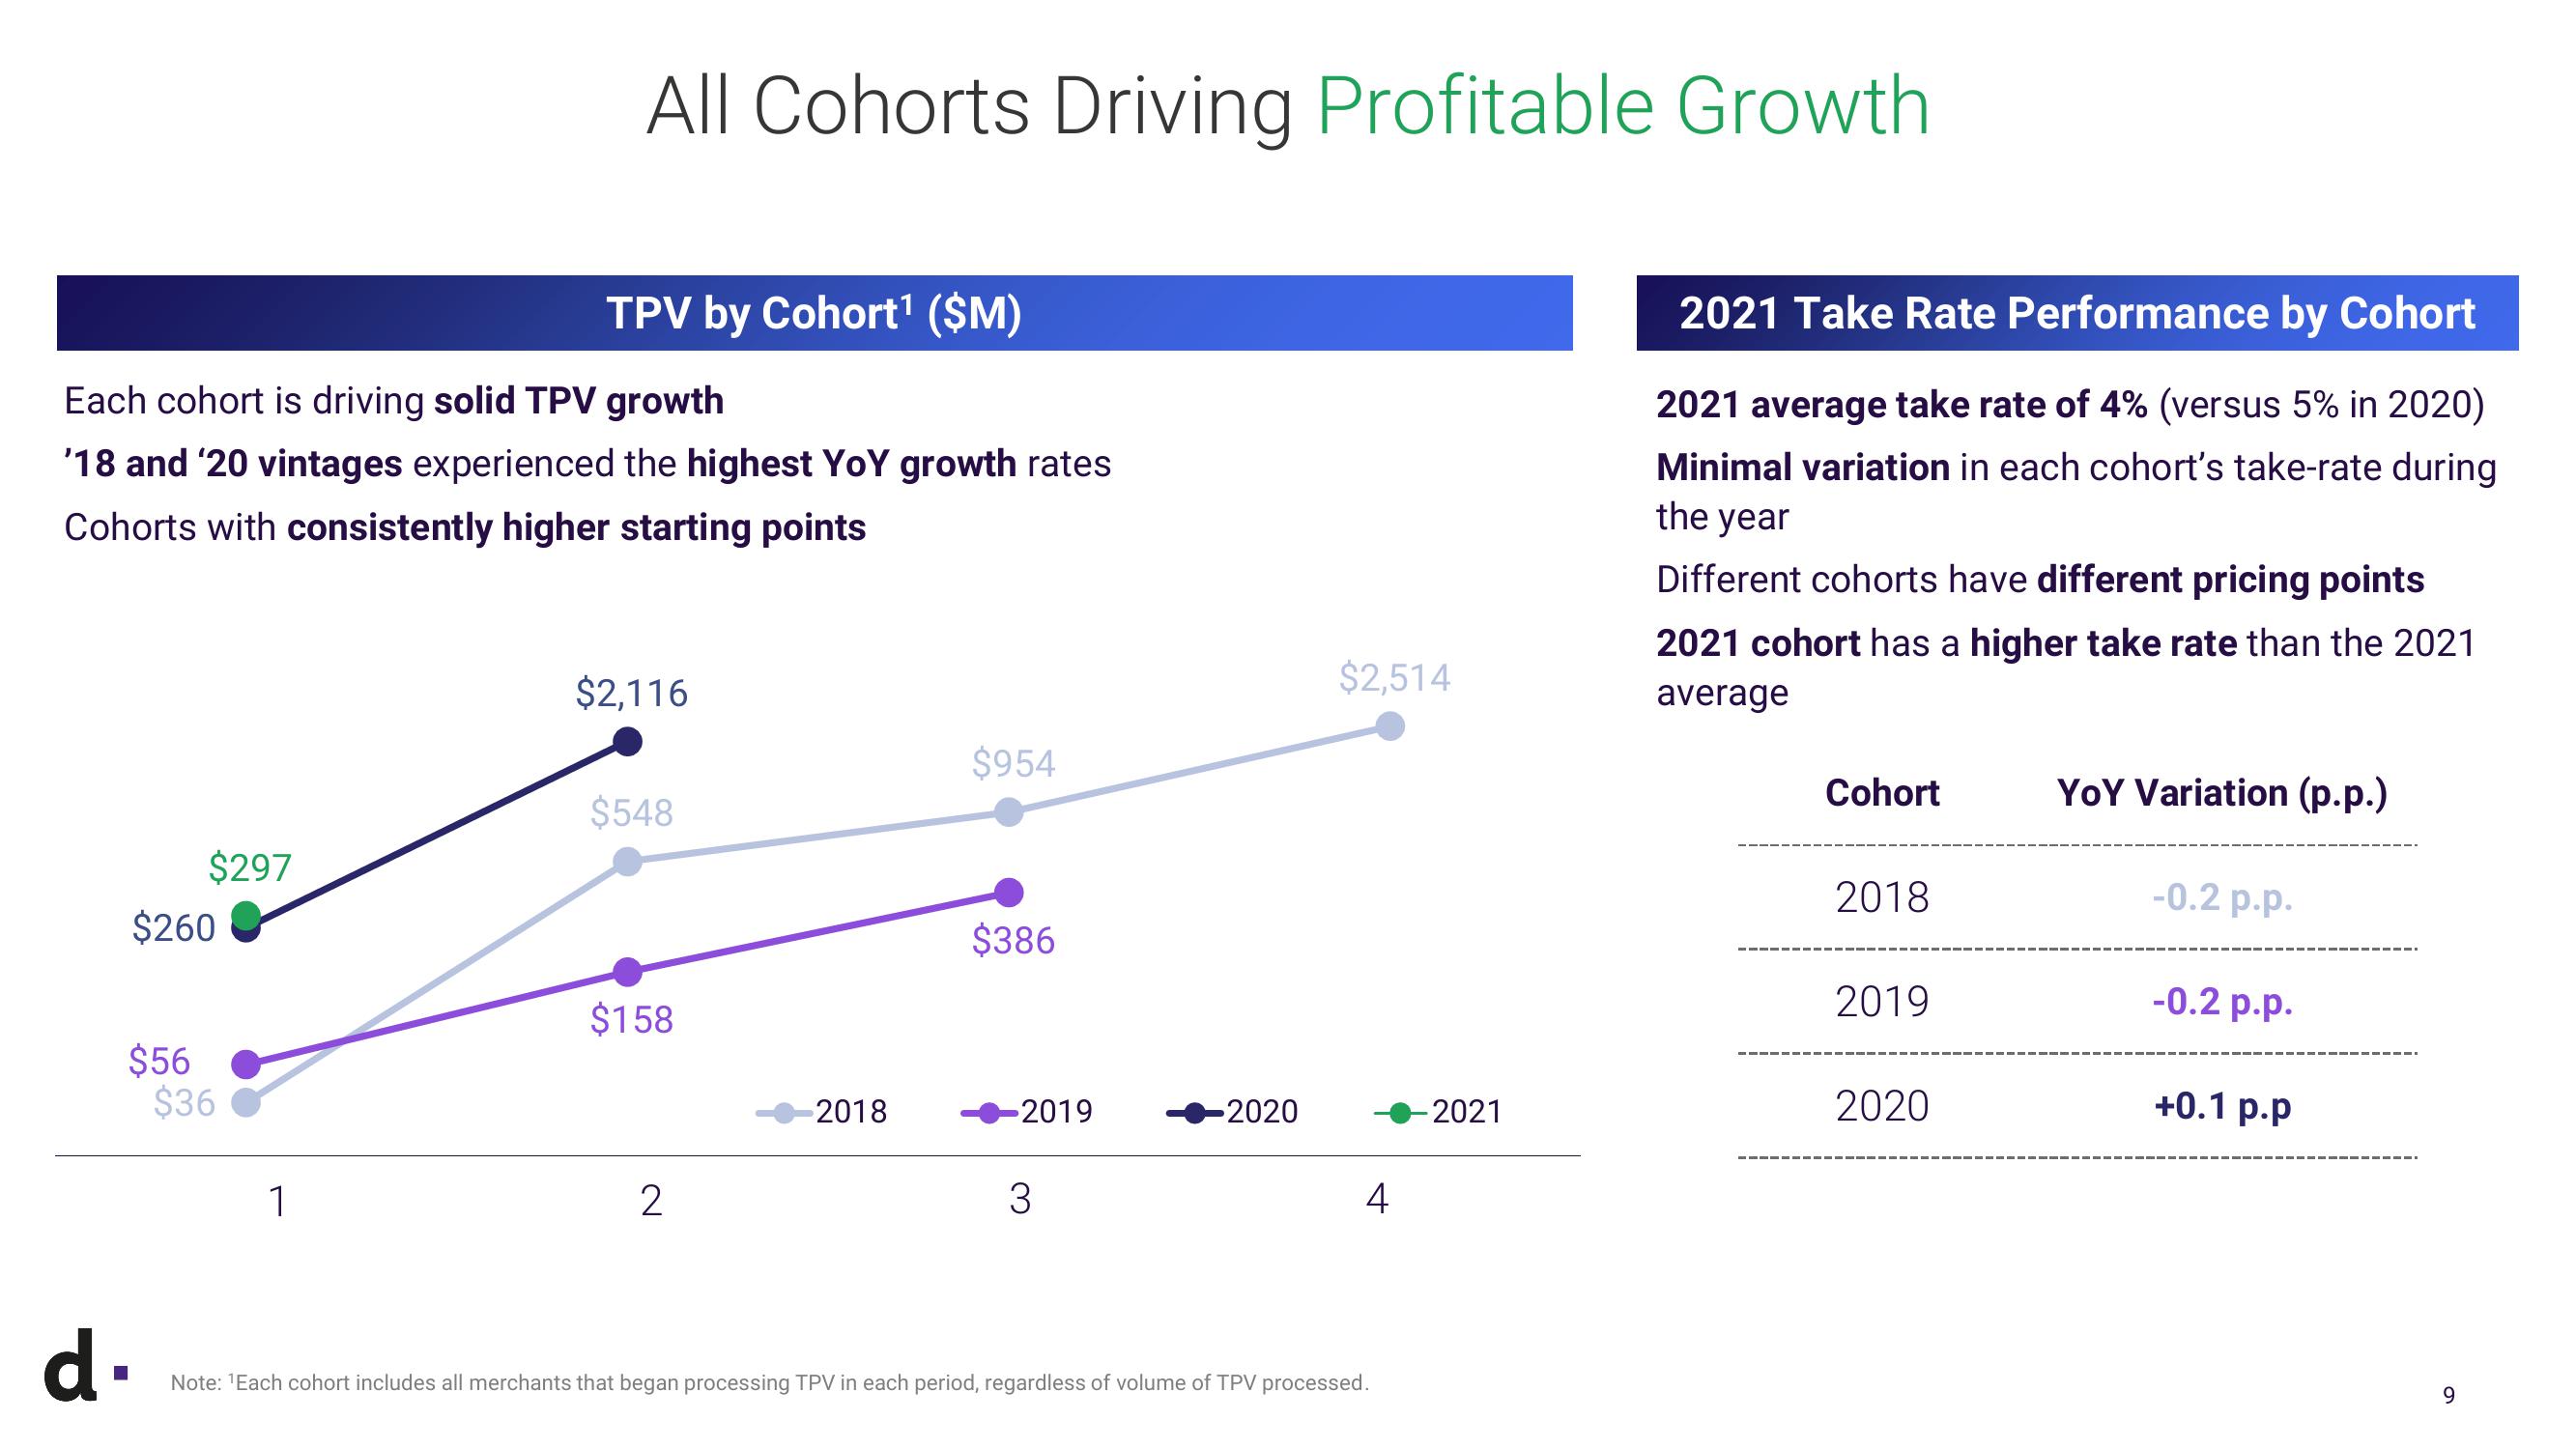
Each cohort is driving solid TPV growth
'18 and '20 vintages experienced the highest YoY growth rates
Cohorts with consistently higher starting points
$260
$56
$297
d.
$36
All Cohorts Driving Profitable Growth
1
TPV by Cohort¹ ($M)
$2,116
$548
$158
2
2018
$954
$386
2019
3
-2020
$2,514
4
Note: ¹Each cohort includes all merchants that began processing TPV in each period, regardless of volume of TPV processed.
-2021
2021 Take Rate Performance by Cohort
2021 average take rate of 4% (versus 5% in 2020)
Minimal variation in each cohort's take-rate during
the year
Different cohorts have different pricing points
2021 cohort has a higher take rate than the 2021
average
Cohort
2018
2019
2020
YOY Variation (p.p.)
-0.2 p.p.
-0.2 p.p.
+0.1 p.p
9View entire presentation