BlackRock Investor Conference Presentation Deck
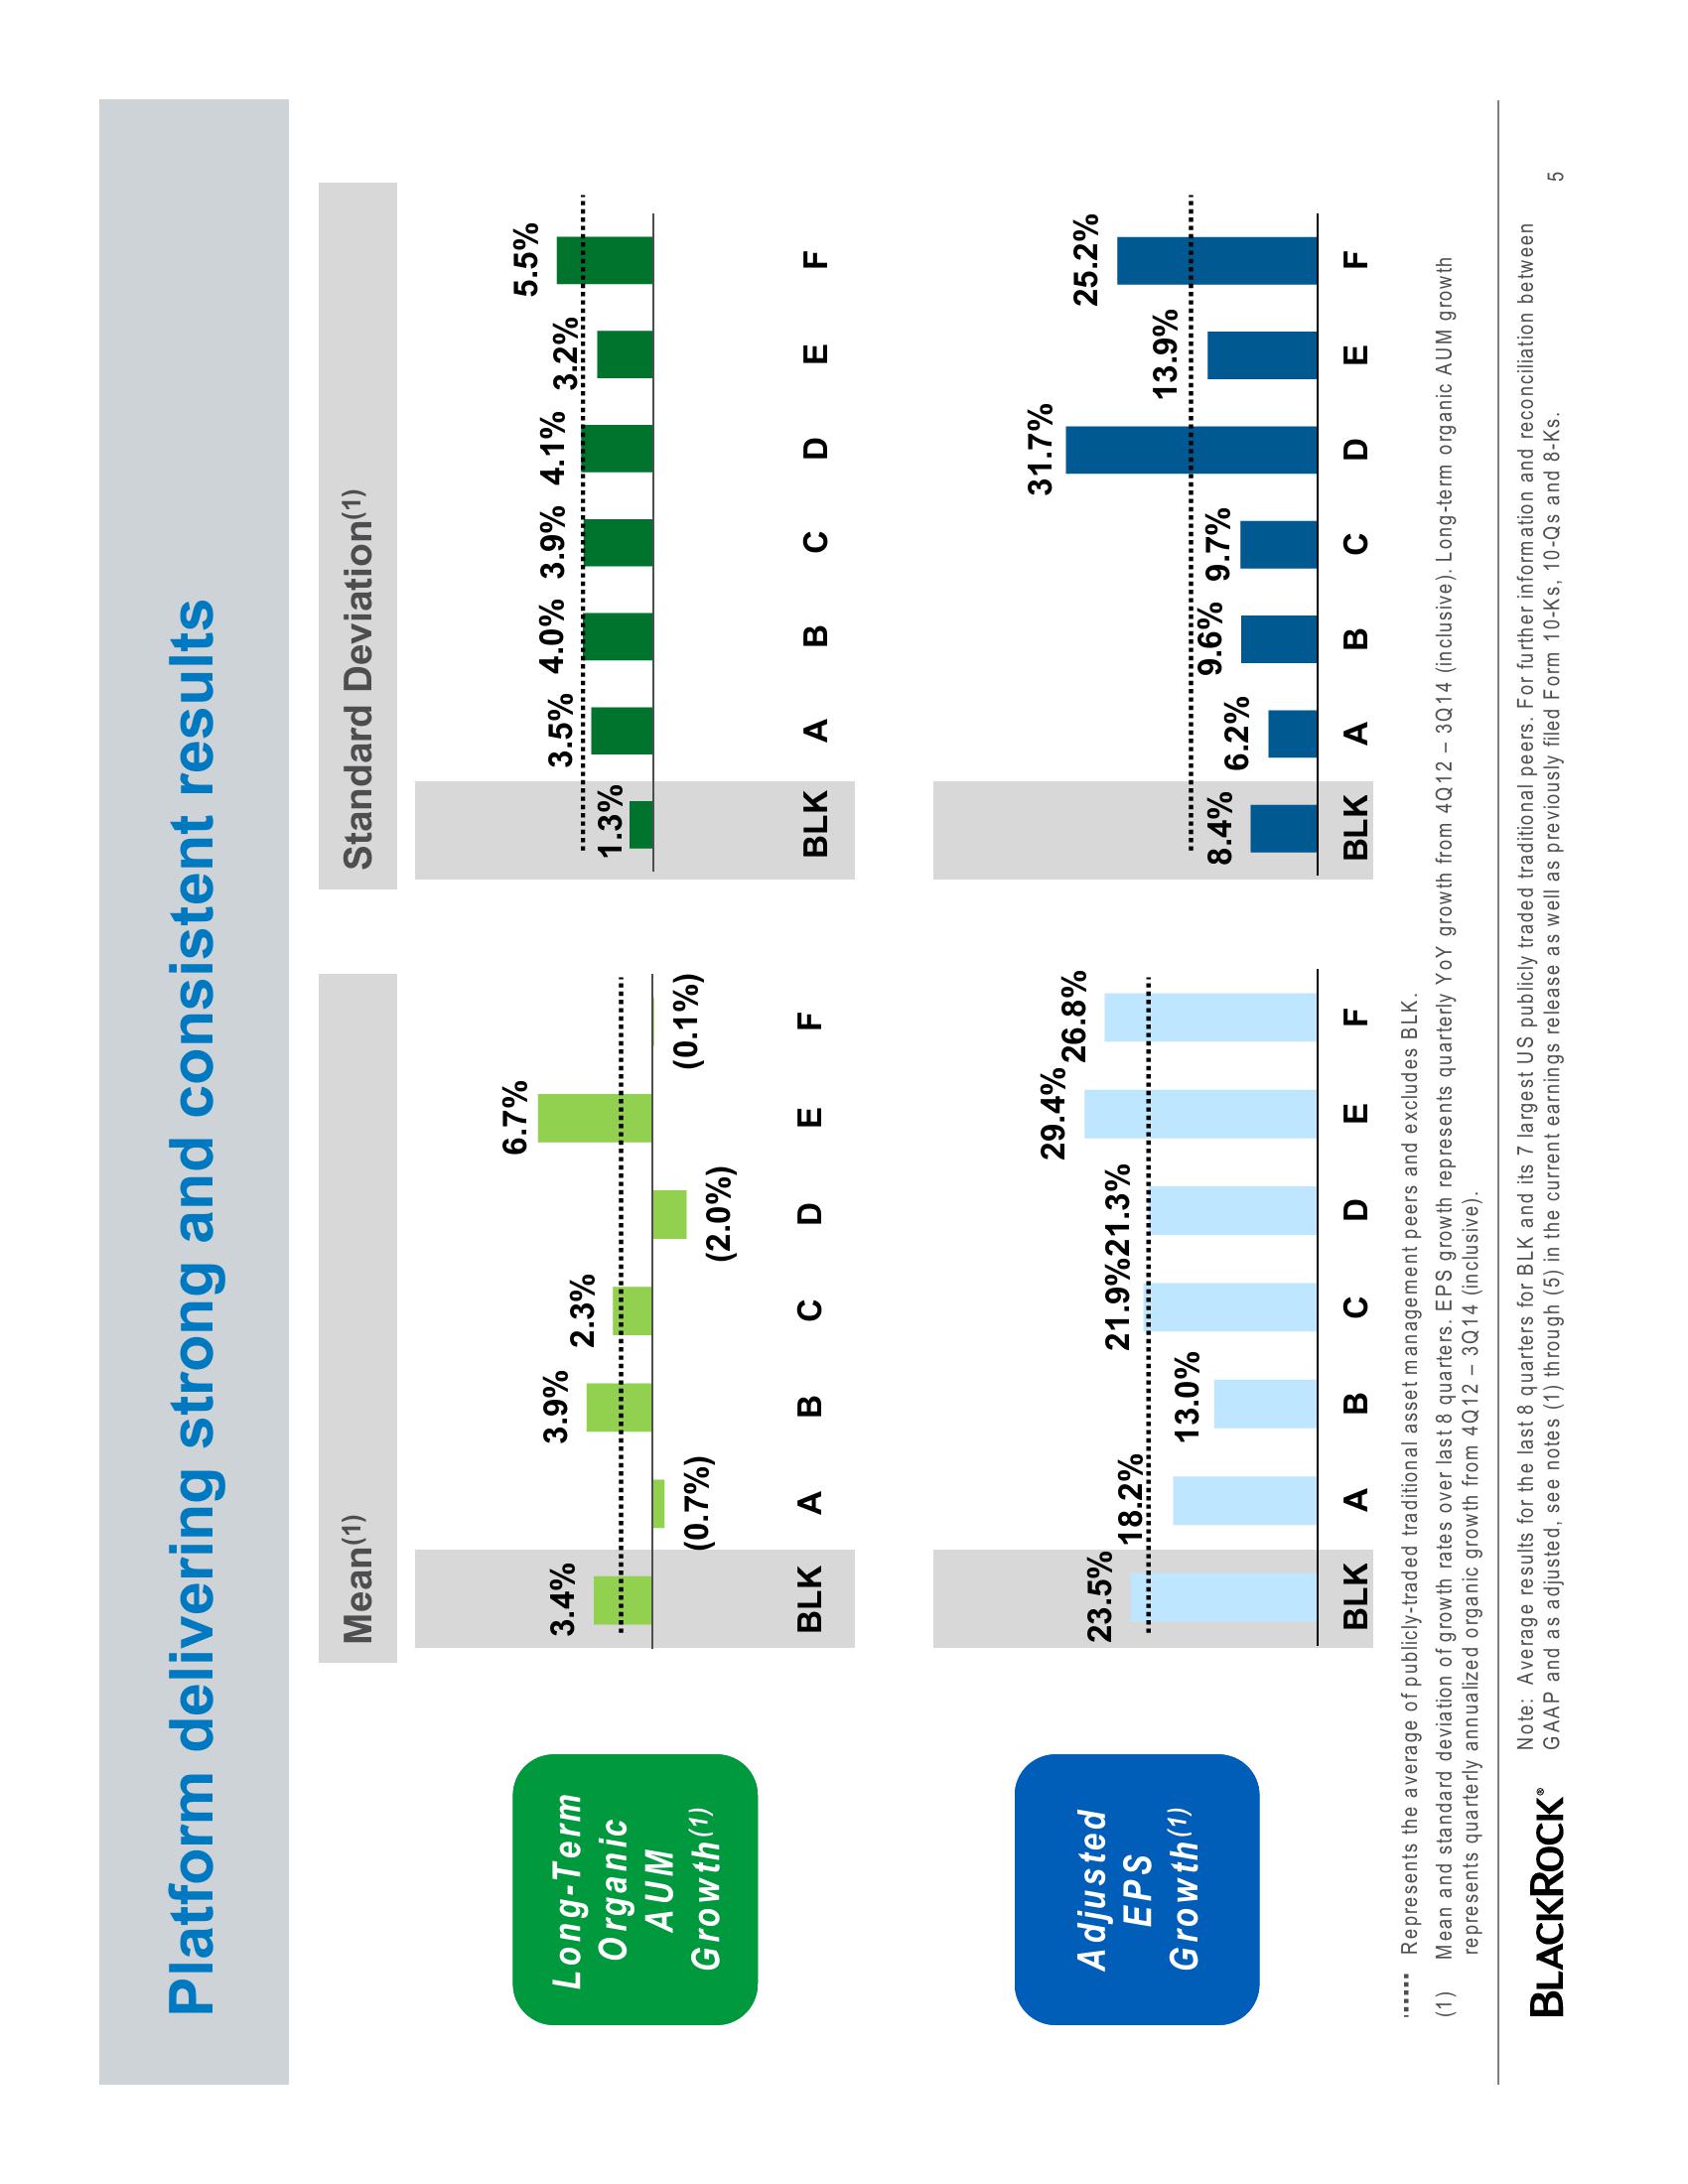
Platform delivering strong and consistent results
Long-Term
Organic
AUM
Growth (¹)
Adjusted
EPS
Growth (1)
(1)
Mean (1)
3.4%
BLK
23.5%
(0.7%)
3.9%
18.2%
2.3%
13.0%
(2.0%)
A B C D
6.7%
DE F
21.9%21.3%
(0.1%)
29.4%
26.8%
Standard Deviation(1)
1.3%
3.5% 4.0% 3.9% 4.1%
8.4%
BLK A B C D E F
6.2%
9.6% 9.7%
5.5%
1
31.7%
3.2%
13.9%
25.2%
BLK
A B C D
E F
BLK A B C D E F
Represents the average of publicly-traded traditional asset management peers and excludes BLK.
Mean and standard deviation of growth rates over last 8 quarters. EPS growth represents quarterly YoY growth from 4Q12-3Q14 (inclusive). Long-term organic AUM growth
represents quarterly annualized organic growth from 4Q12 - 3Q14 (inclusive).
BLACKROCK®
Note: Average results for the last 8 quarters for BLK and its 7 largest US publicly traded traditional peers. For further information and reconciliation between
GAAP and as adjusted, see notes (1) through (5) in the current earnings release as well as previously filed Form 10-Ks, 10-Qs and 8-Ks.
5View entire presentation