OppFi Results Presentation Deck
15
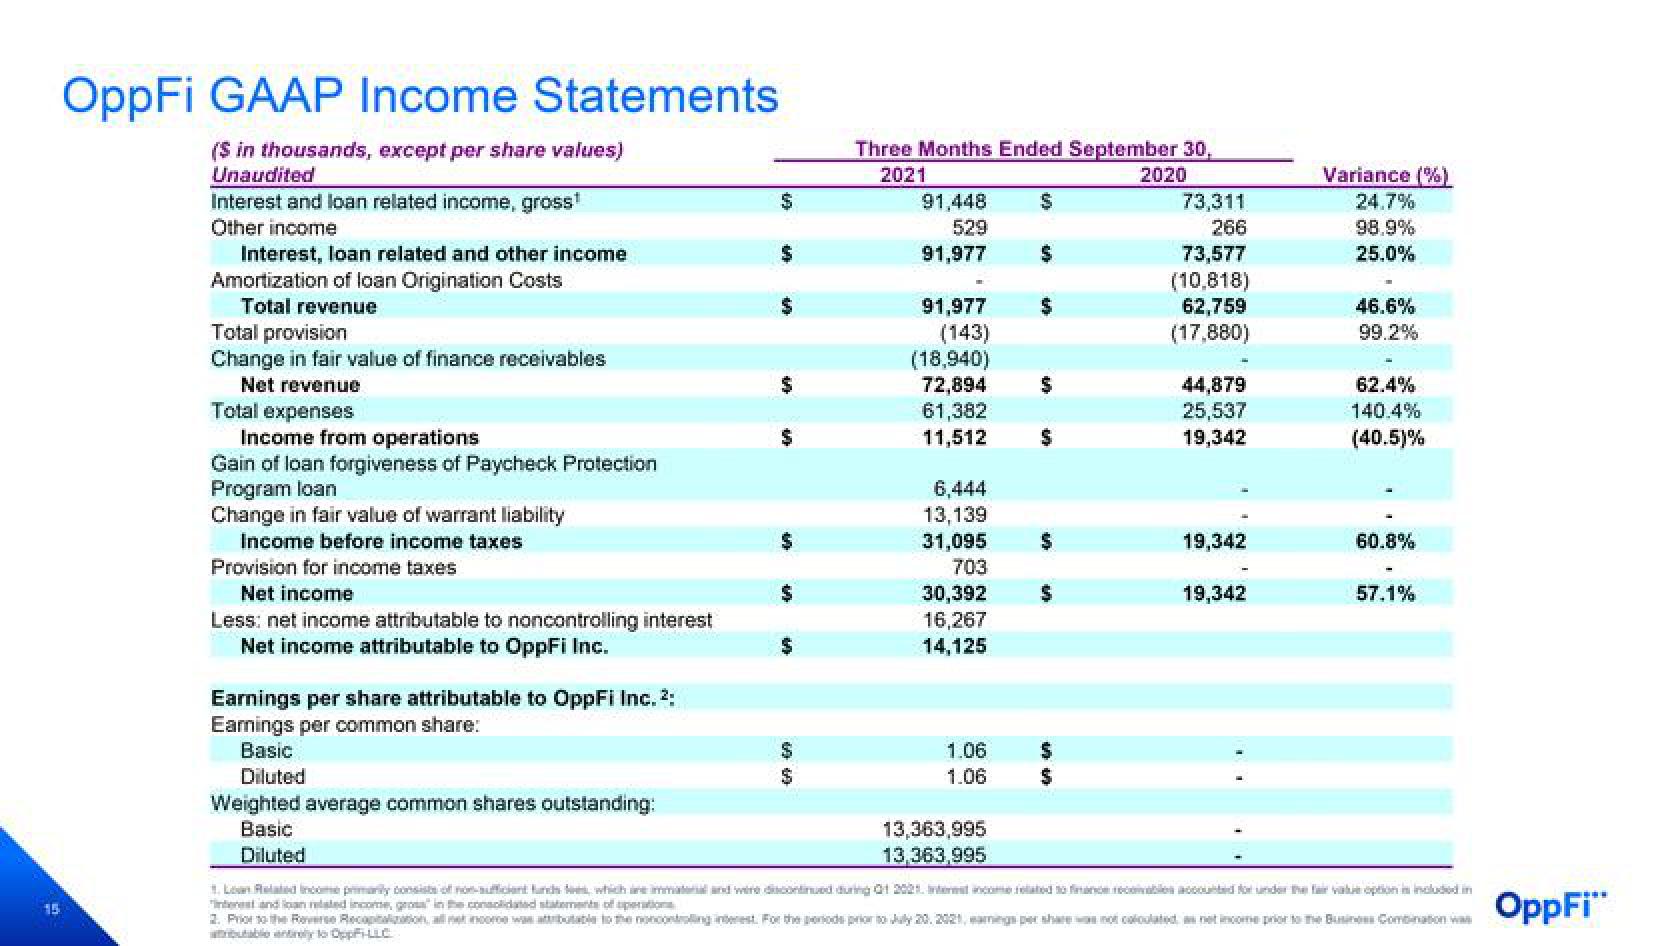
OppFi GAAP Income Statements
($ in thousands, except per share values)
Unaudited
Interest and loan related income, gross¹
Other income
Interest, loan related and other income
Amortization of loan Origination Costs
Total revenue
Total provision
Change in fair value of finance receivables
Net revenue
Total expenses
Income from operations
Gain of loan forgiveness of Paycheck Protection
Program loan
Change in fair value of warrant liability
Income before income taxes
Provision for income taxes
Net income
Less: net income attributable to noncontrolling interest
Net income attributable to OppFi Inc.
Earnings per share attributable to OppFi Inc. ²:
Earnings per common share:
Basic
Diluted
Weighted average common shares outstanding:
Basic
Diluted
$
$
$
69 69
Three Months Ended September 30,
2021
2020
91,448
529
91,977 $
91,977
(143)
(18,940)
72,894
61,382
11,512
6,444
13,139
31,095
703
30,392
16,267
14,125
1.06
1.06
$
13,363,995
13,363,995
$
$
$
$
$
$
73,311
266
73,577
(10,818)
62,759
(17,880)
44,879
25,537
19,342
19,342
19,342
Variance (%)
24,7%
98.9%
25.0%
46.6%
99.2%
62.4%
140.4%
(40.5)%
60.8%
57.1%
1. La Related Income primarily consists of non-sufficient funds, which are immaterial and wire discontinued during 01 2021. Internatincome related to finance recovables accounted for under the fair value option is included in
interest and loan related income, gros" in the consolidated statements of pati
2. Prior to the Reverse Recopitalization, all net incore was attributable to the noncontrolling interest. For the periode prior to July 20, 2021, eaegs per share not calculated as net income prior to The Business Combination was
atributable entirely to OppF-LLC
OppFi"View entire presentation