Tesla Results Presentation Deck
24
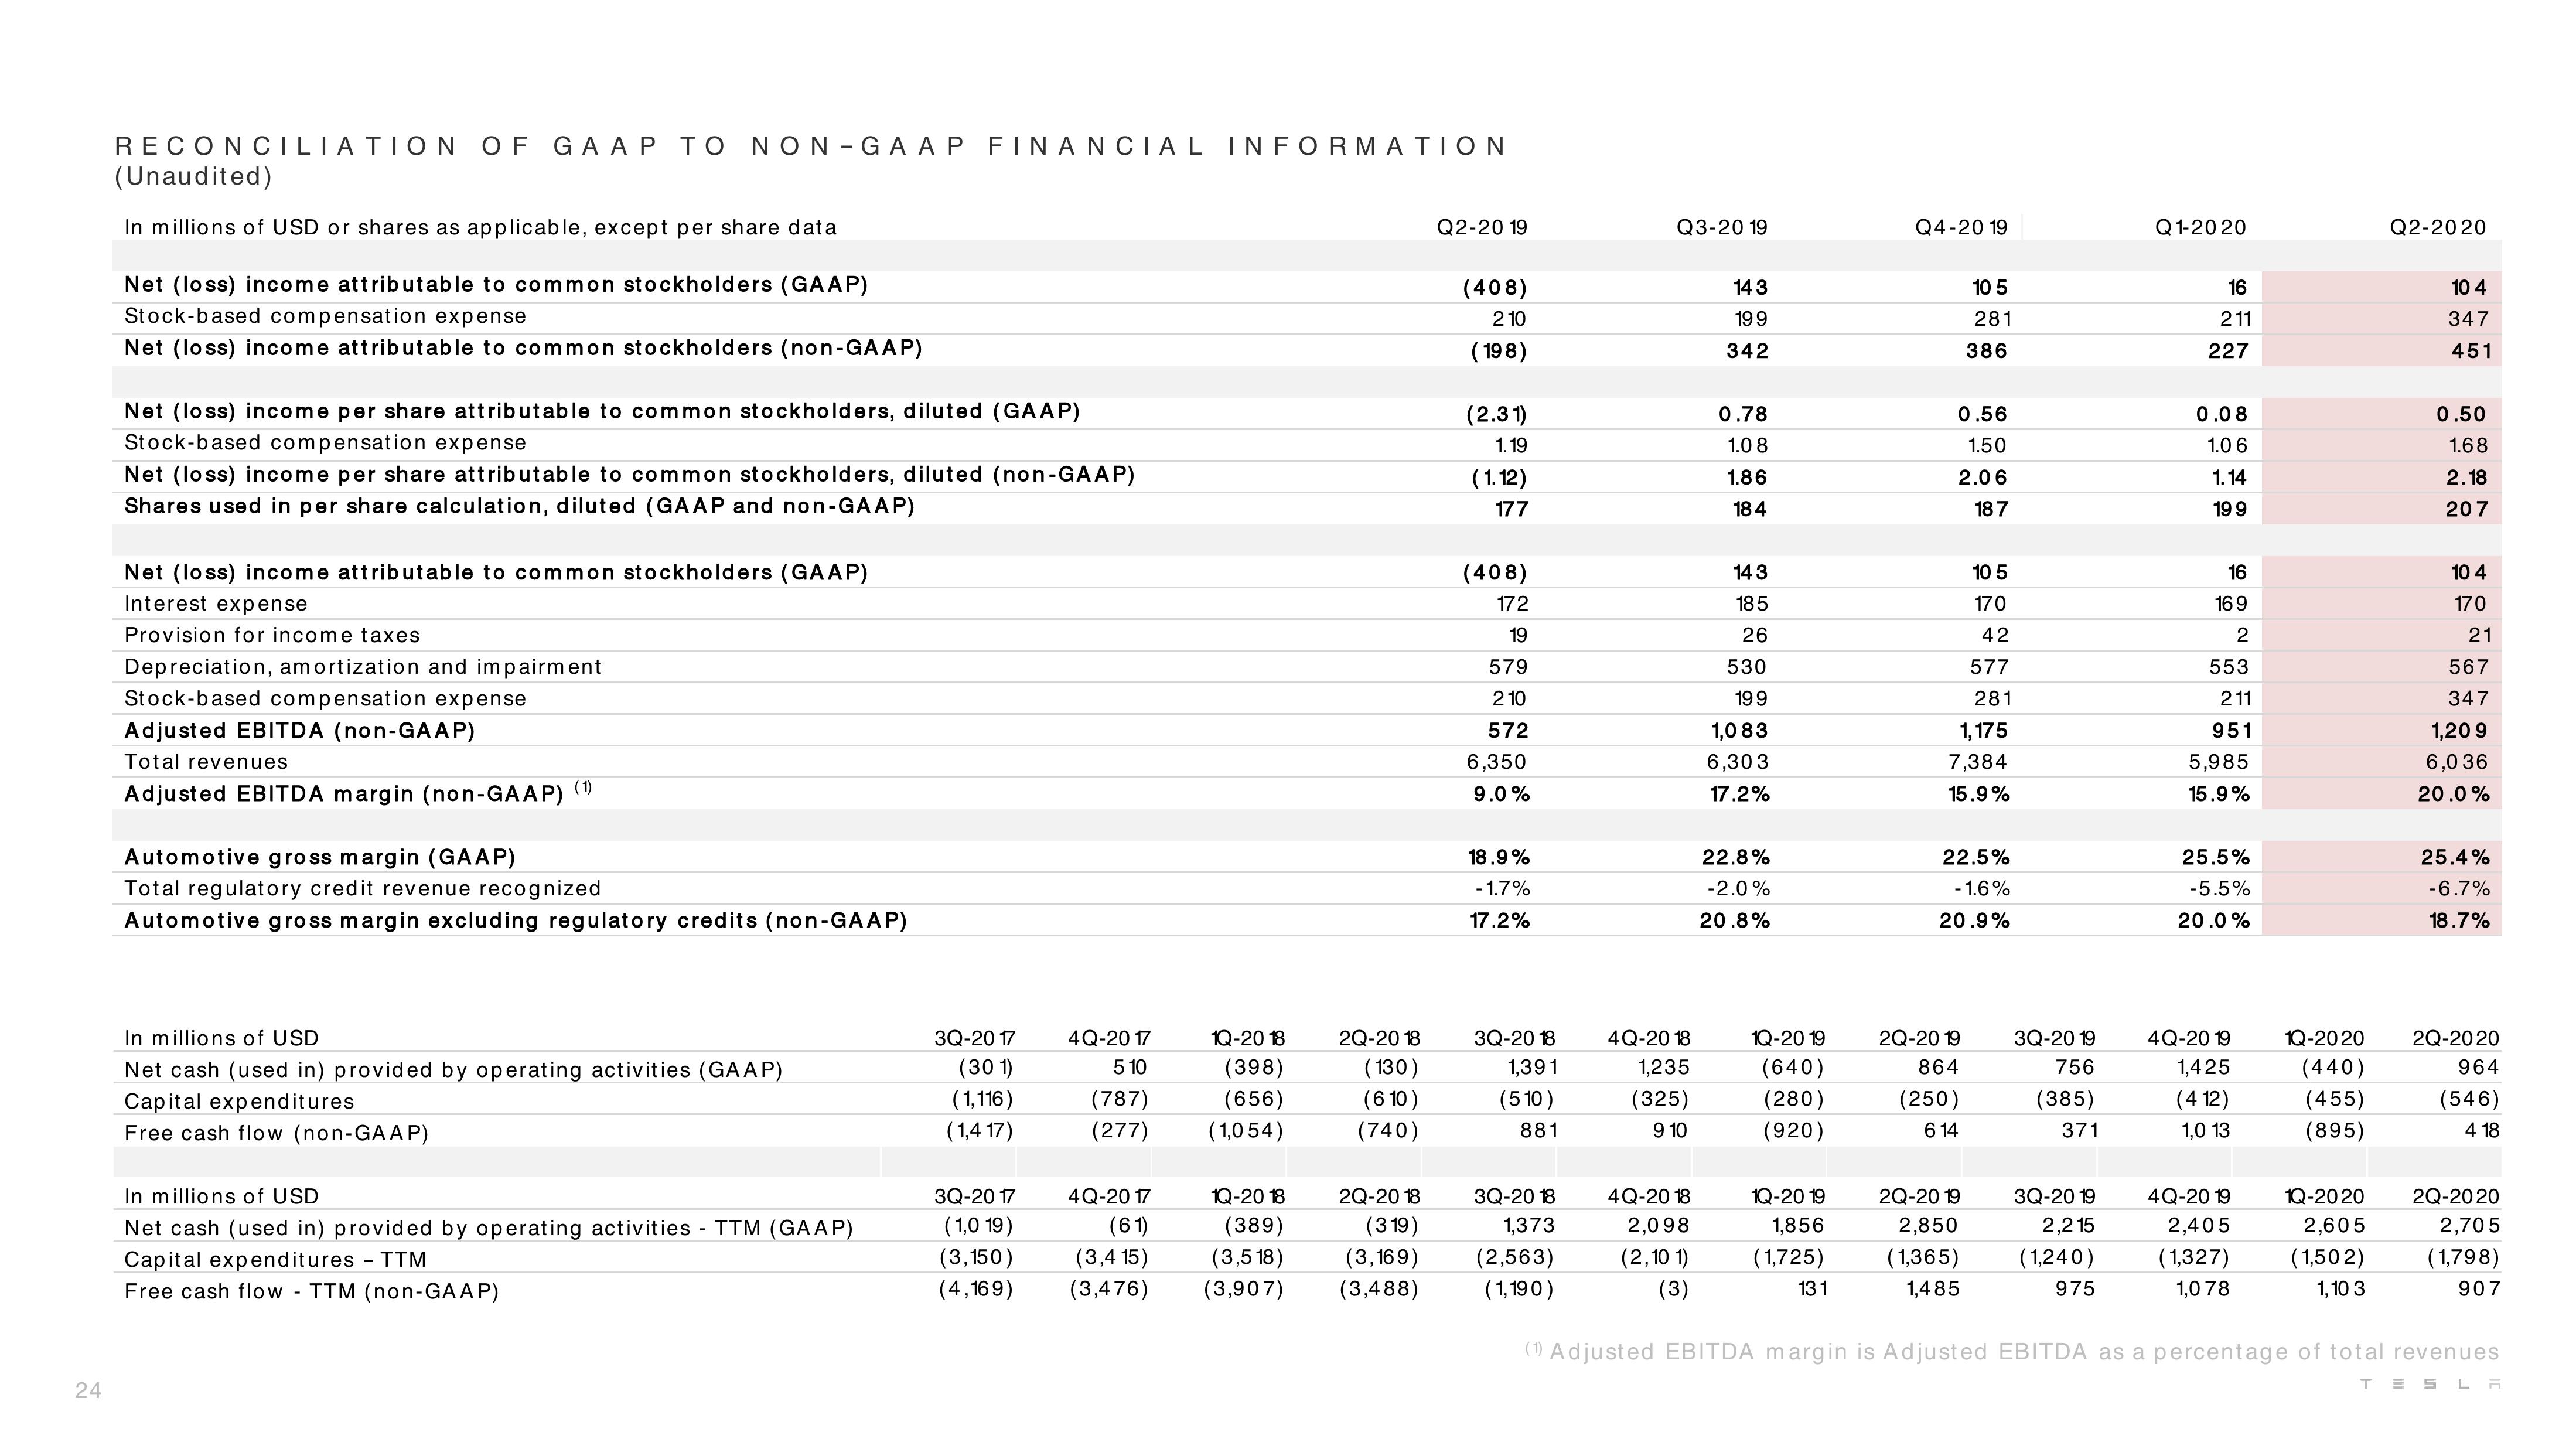
RECONCILIATION OF GAAP TO NON-GAAP FINANCIAL INFORMATION
(Unaudited)
In millions of USD or shares as applicable, except per share data
Net (loss) income attributable to common stockholders (GAAP)
Stock-based compensation expense
Net (loss) income attributable to common stockholders (non-GAAP)
Net (loss) income per share attributable to common stockholders, diluted (GAAP)
Stock-based compensation expense
Net (loss) income per share attributable to common stockholders, diluted (non-GAAP)
Shares used in per share calculation, diluted (GAAP and non-GAAP)
Net (loss) income attributable to common stockholders (GAAP)
Interest expense
Provision for income taxes
Depreciation, amortization and impairment
Stock-based compensation expense
Adjusted EBITDA (non-GAAP)
Total revenues
Adjusted EBITDA margin (non-GAAP) (¹)
Automotive gross margin (GAAP)
Total regulatory credit revenue recognized
Automotive gross margin excluding regulatory credits (non-GAAP)
In millions of USD
Net cash (used in) provided by operating activities (GAAP)
Capital expenditures
Free cash flow (non-GAAP)
In millions of USD
Net cash (used in) provided by operating activities - TTM (GAAP)
Capital expenditures - TTM
Free cash flow - TTM (non-GAAP)
3Q-20 17
(301)
(1,116)
(1,4 17)
4Q-20 17
5 10
(787)
(277)
3Q-20 17
(1,0 19)
(3,150)
(4,169) (3,476)
4Q-20 17
(61)
(3,4 15)
1Q-20 18
(398)
(656)
(1,054)
1Q-20 18
(389)
(3,518)
(3,907)
2Q-20 18
(130)
(610)
(740)
2Q-20 18
(319)
(3,169)
(3,488)
Q2-20 19
(408)
210
(198)
(2.31)
1.19
(1.12)
177
(408)
172
19
579
210
572
6,350
9.0%
18.9%
-1.7%
17.2%
3Q-20 18
1,391
(510)
881
3Q-20 18
1,373
(2,563)
(1,190)
Q3-20 19
4Q-2018
1,235
(325)
9 10
4Q-20 18
2,098
(2,10 1)
(3)
143
199
342
0.78
1.08
1.86
184
143
185
26
530
199
1,083
6,303
17.2%
22.8%
-2.0%
20.8%
1Q-20 19
(640)
(280)
(920)
1Q-20 19
1,856
(1,725)
131
Q4-20 19
10 5
281
0.56
1.50
2.06
187
386
2Q-20 19
864
(250)
6 14
1,175
7,384
15.9%
2Q-20 19
2,850
(1,365)
1,485
10 5
170
42
577
281
22.5%
-1.6%
20.9%
3Q-20 19
756
(385)
371
3Q-20 19
2,215
(1,240)
975
Q1-2020
16
211
227
0.08
1.0 6
1.14
199
16
169
2
553
211
951
5,985
15.9%
25.5%
-5.5%
20.0%
4Q-20 19
1,425
(412)
1,0 13
4Q-20 19
2,405
(1,327)
1,078
1Q-2020
(440)
(455)
(895)
1Q-2020
2,605
(1,502)
1,10 3
Q2-2020
10 4
347
451
0.50
1.68
2.18
207
10 4
170
21
567
347
1,20 9
6,036
20.0%
25.4%
-6.7%
18.7%
2Q-2020
964
(546)
4 18
2Q-2020
2,705
(1,798)
907
(1) Adjusted EBITDA margin is Adjusted EBITDA as a percentage of total revenues
TESLAView entire presentation