NuStar Energy Investor Conference Presentation Deck
NuStar
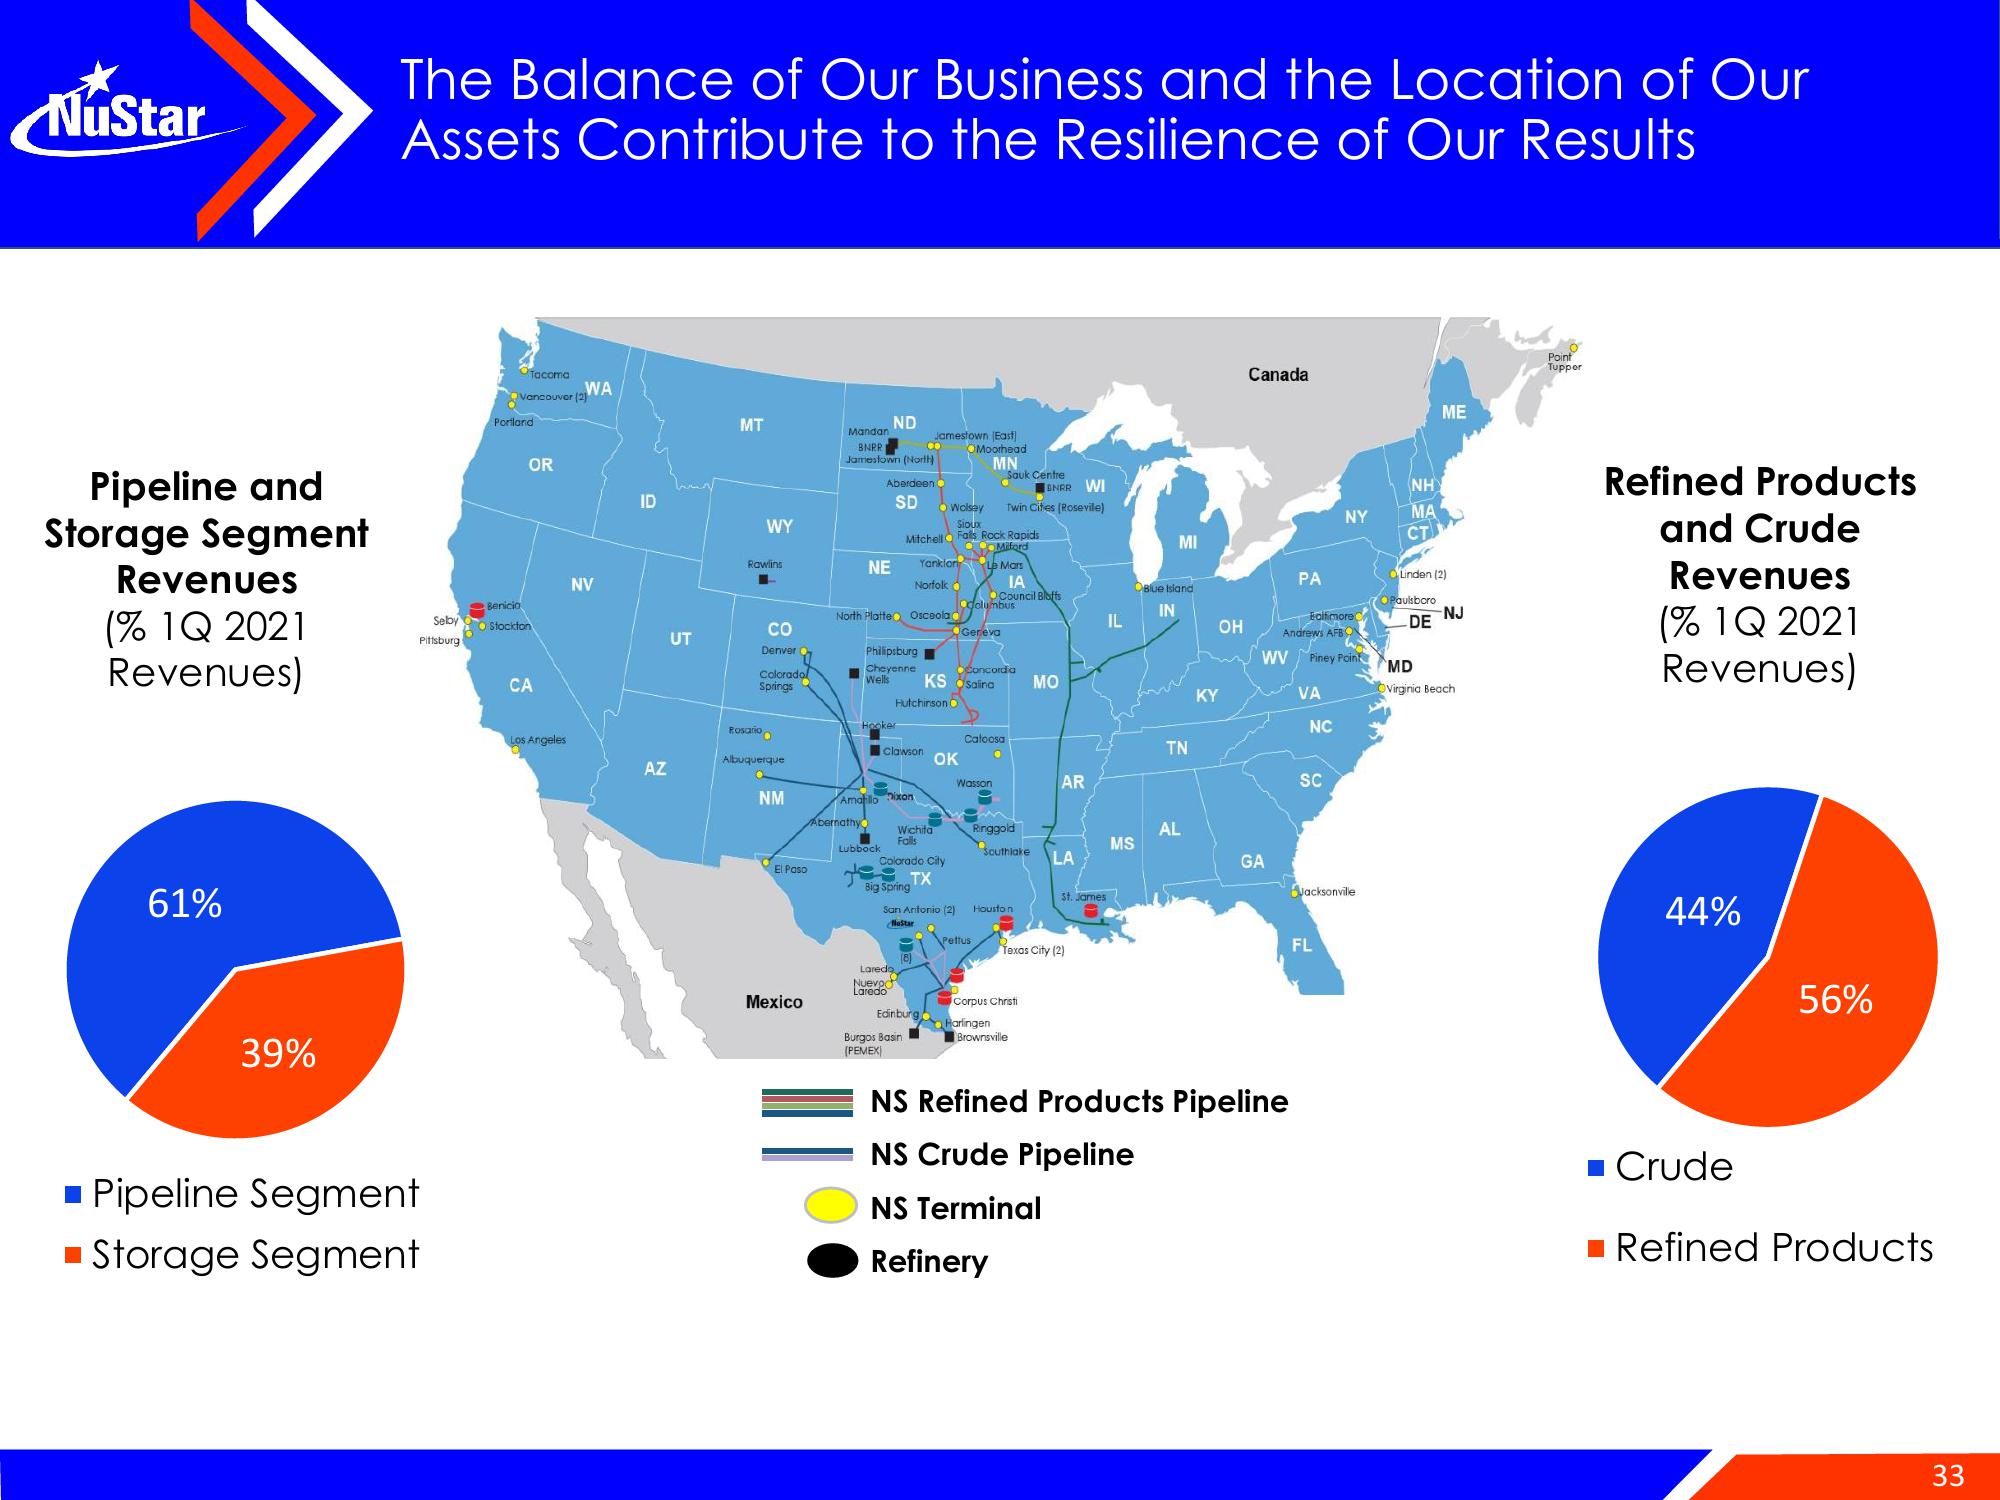
Pipeline and
Storage Segment
Revenues
(% 1Q 2021
Revenues)
61%
39%
The Balance of Our Business and the Location of Our
Assets Contribute to the Resilience of Our Results
Seby
Pittsburg
■ Pipeline Segment
■ Storage Segment
Tacoma
Vancouver (2)
Poriland
OR
Benicio
Stockton
CA
Los Angeles
WA
NV
ID
AZ
UT
MT
WY
Rawlins
CO
Denver
Coloradol
Springs
Rosano
Albuquerque
NM
El Paso
Mexico
Mandan
BNRR
..
Jamestown (North)
NE
Abernathy
ND
Amatllo
Aberdeen
SD
North Platte Osceola
Philipsburg
Cheyenne
Wells
Hooker
Lubbock
Wolsey
Sioux
Mitchell Fals Rock Rapids
Milford
Le Mars
KS
Hutchinson C
Clawson
nixon
Laredo
Nuevo
Laredo
Jamestown East
Yanklar
Norfolk
Wichita
Falls
Colorado City
3
TX
Big Spring
(8)
San Antonio (2)
NoStar
Burgos Basin
(PEMEX)
Edinburg
OK
Moorhead
MN
Geneva
Catoosa
Sauk Centre
Wasson
Pettus
Concordia
Salina
Twin Cities (Rosevile)
uncil Bluffs
Ringgold
Southlake
ENER WI
Houston
Corpus Christi
Harlingen
Brownsville
ΜΟ
AR
LA
St. James
Texas City (2)
IL
MS
MI
Blue Island
IN
TN
AL
OH
KY
Canada
GA
PA
Baltimore
Andrews AFB
WV Piney Point
VA
NS Refined Products Pipeline
NS Crude Pipeline
NS Terminal
Refinery
NC
SC
NY
Jacksonville
FL
NH
MA
CT
ME
Linden (2)
Paulsboro
DE
NJ
MD
Virginia Beach
Point
Tupper
Refined Products
and Crude
Revenues
(% 1Q 2021
Revenues)
44%
56%
■ Crude
Refined Products
33View entire presentation