Cheesecake Factory Investor Presentation Deck
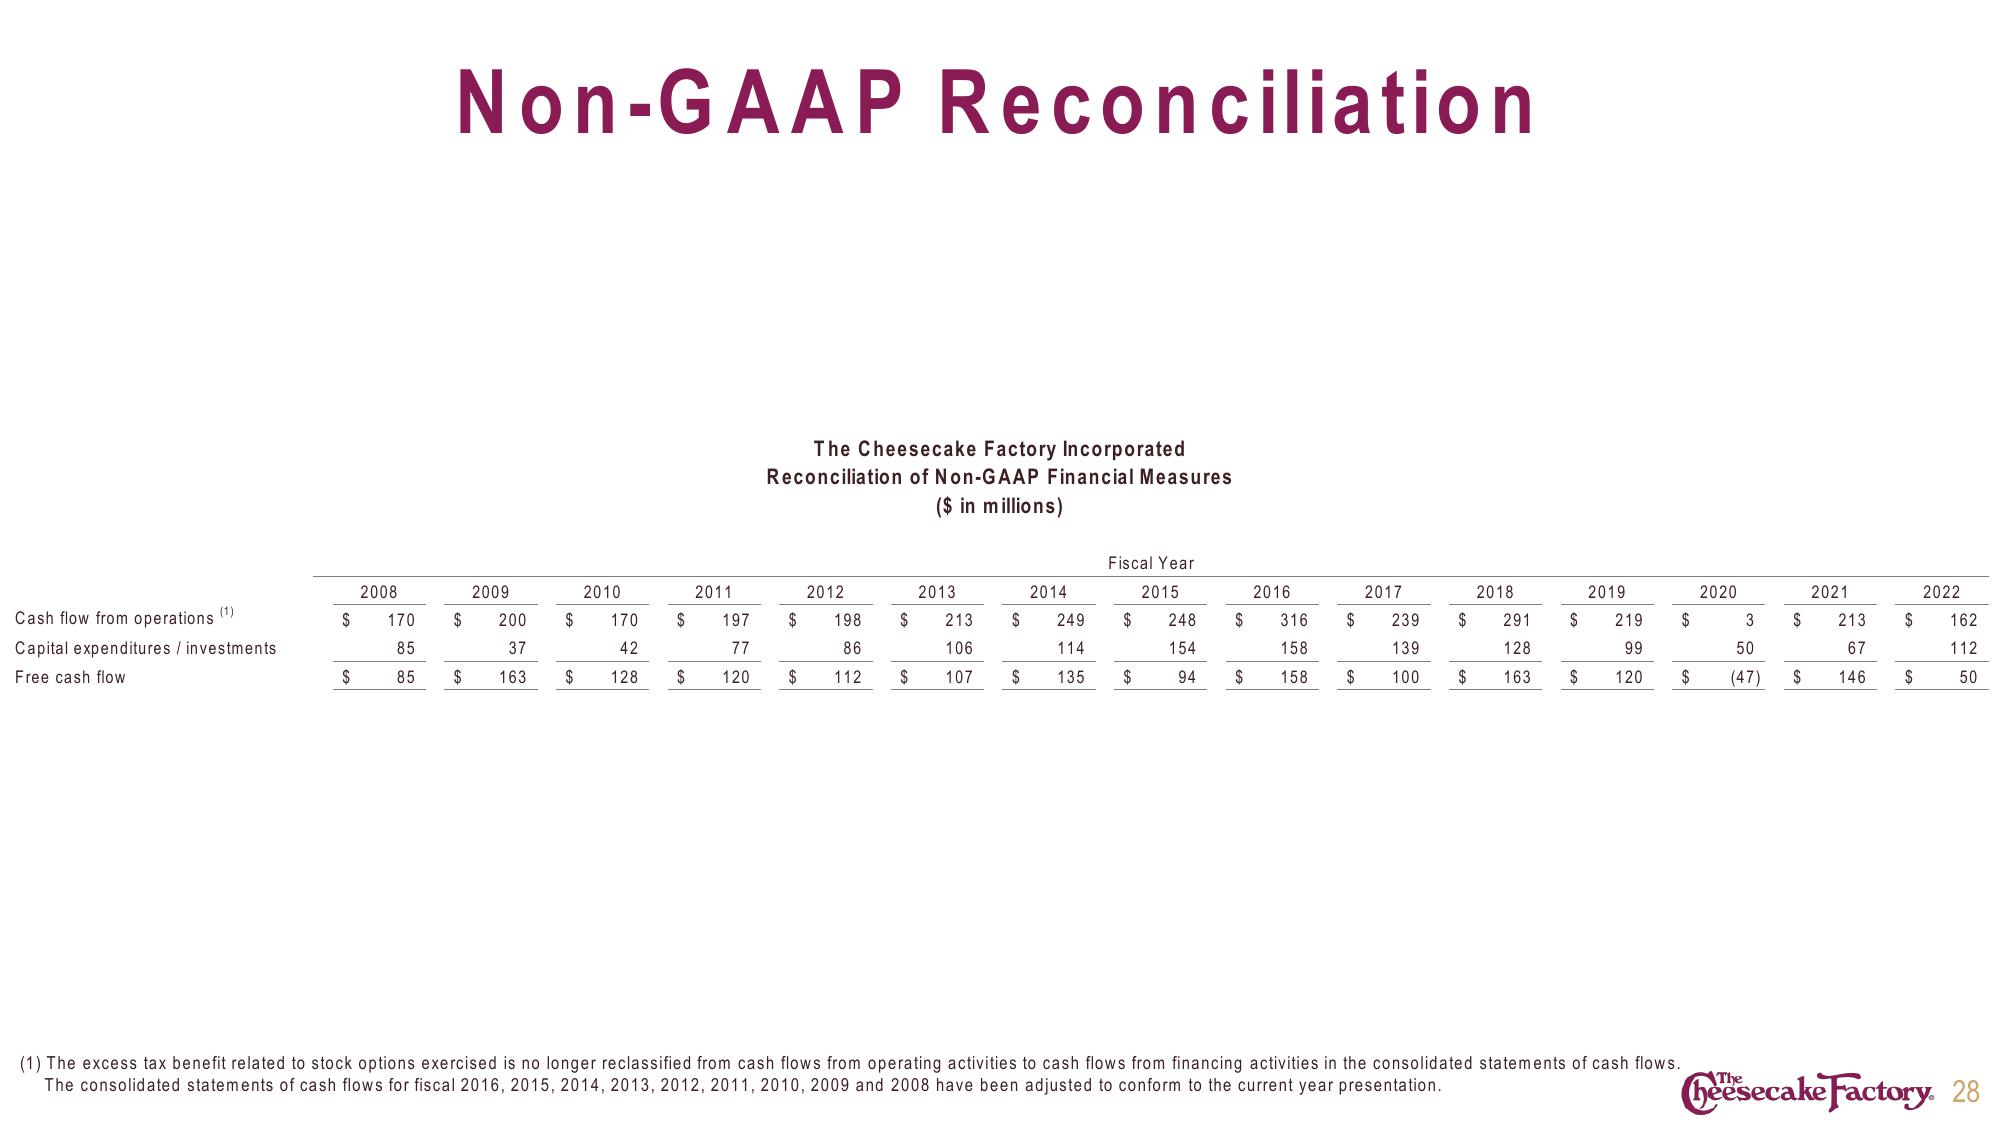
Cash flow from operations (1)
Capital expenditures / investments
Free cash flow
Non-GAAP Reconciliation
2008
2009
$ 170 $ 200
85
85 $
37
163
$
$
$
2010
$
170
42
128 $
2011
197
77
120
The Cheesecake Factory Incorporated
Reconciliation of Non-GAAP Financial Measures
($ in millions)
$
$
2012
$
198
86
112 $
Fiscal Year
2015
2013
213
106
2014
$ 249
114
107 $ 135 $
$
248
154
94
$
2016
2017
316 $ 239 $
158
139
$ 158 $ 100
2018
291
128
$ 163
$
2019
$
2020
(1) The excess tax benefit related to stock options exercised is no longer reclassified from cash flows from operating activities to cash flows from financing activities in the consolidated statements of cash flows.
The consolidated statements of cash flows for fiscal 2016, 2015, 2014, 2013, 2012, 2011, 2010, 2009 and 2008 have been adjusted to conform to the current year presentation.
219
99
50
$ 120 $ (47)
3
2021
$ 213
67
146
$
$
$
2022
162
112
50
heesecake Factory. 28View entire presentation