2nd Quarter 2021 Investor Presentation
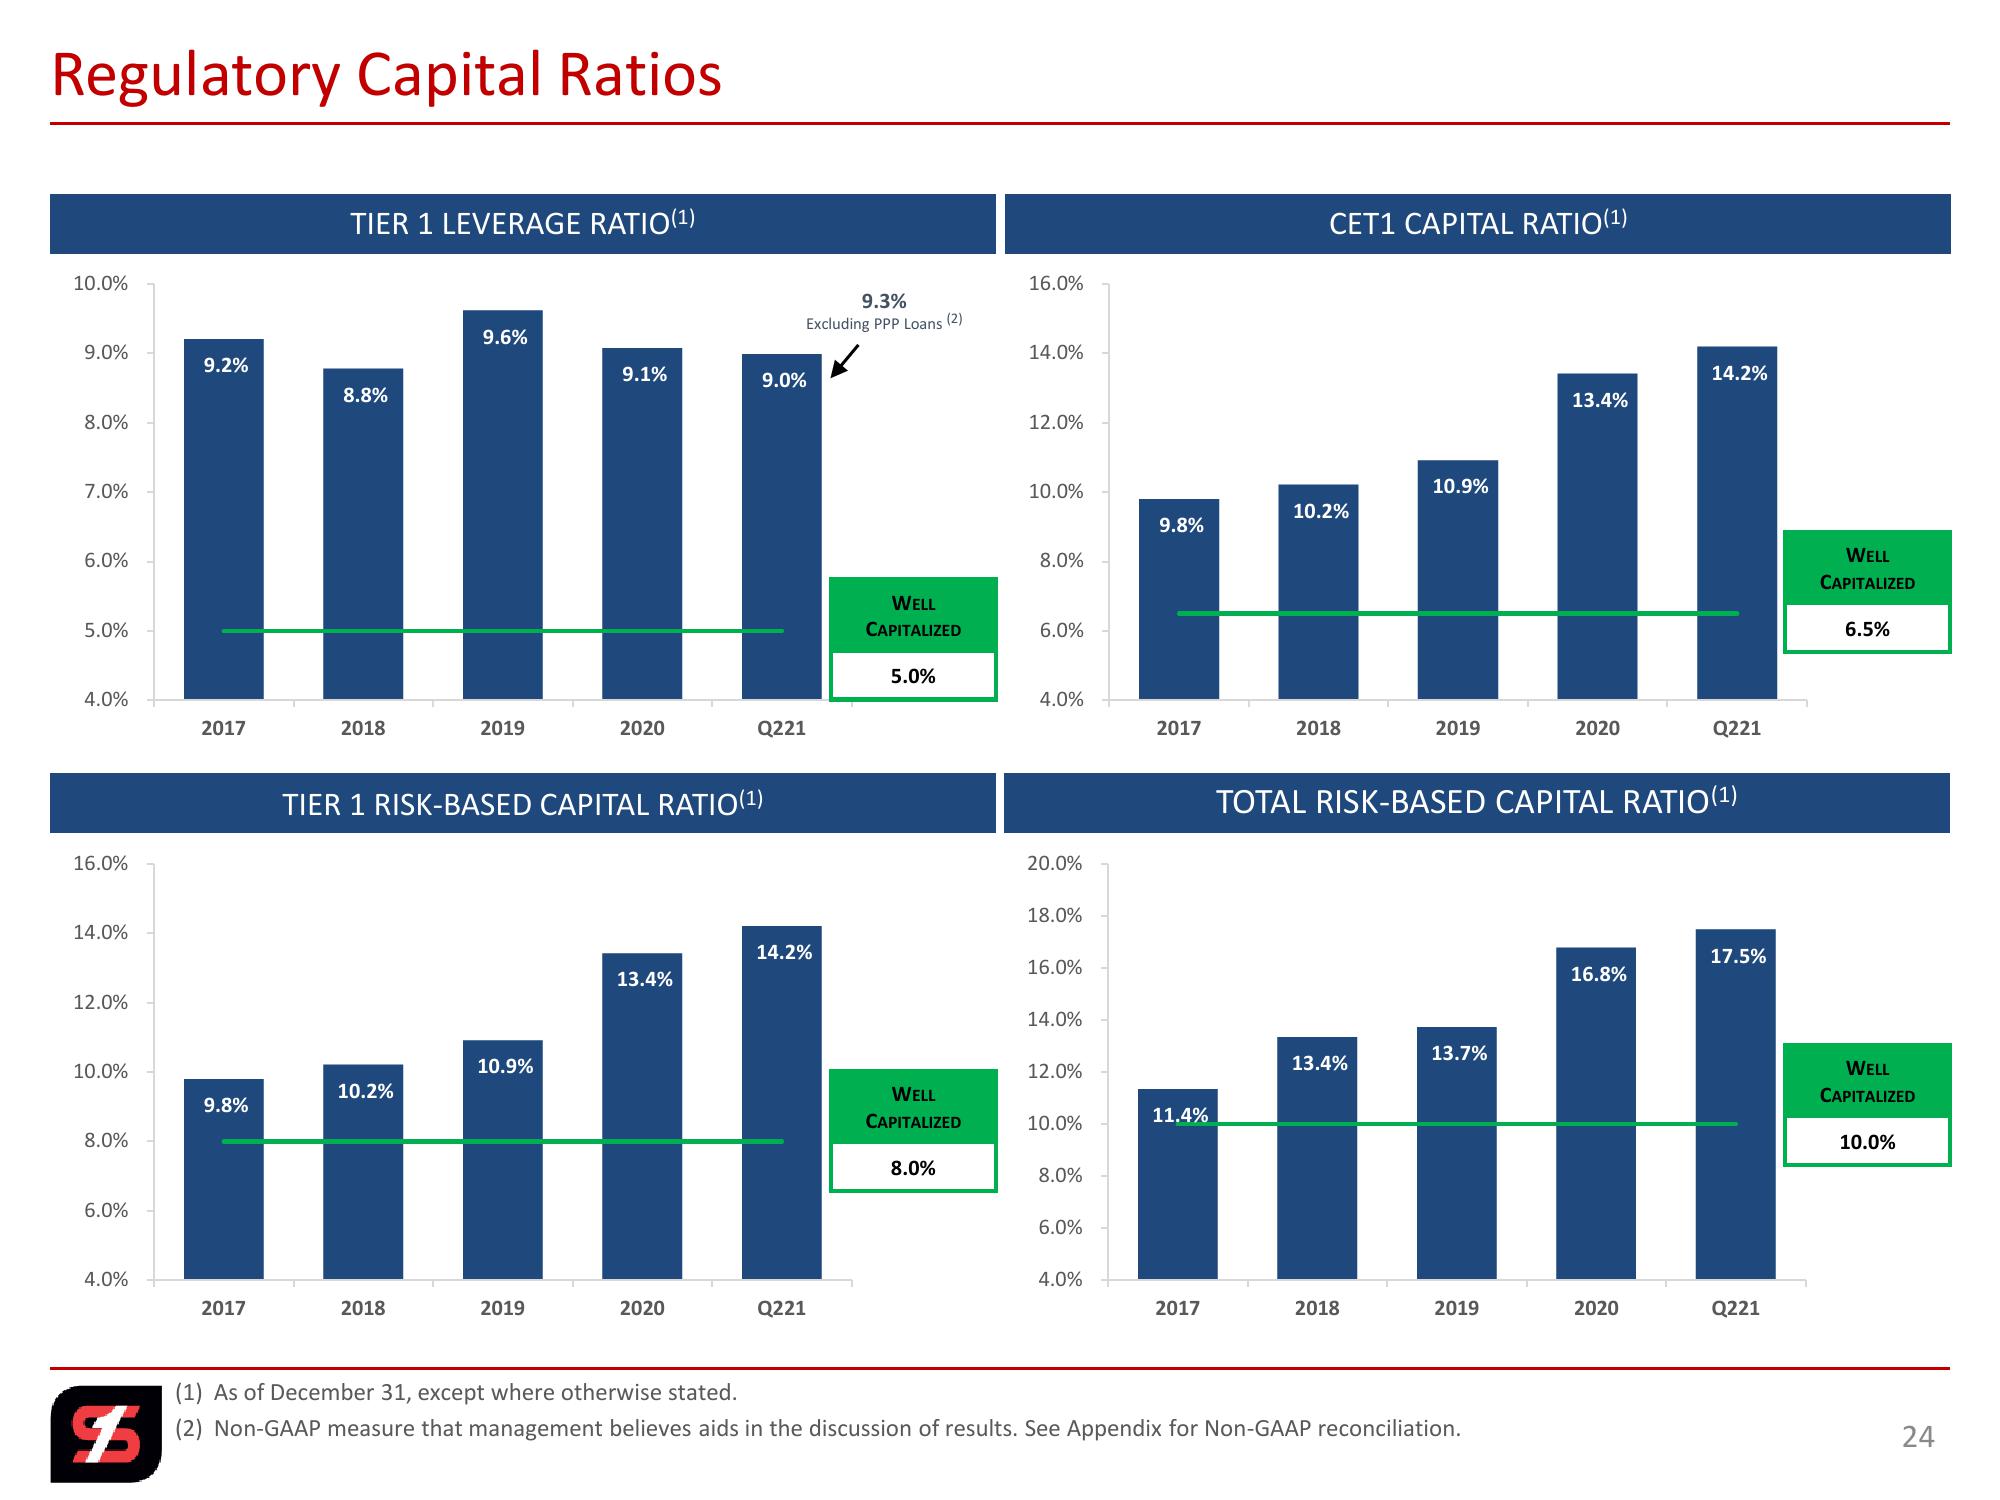
Regulatory Capital Ratios
10.0%
9.0%
8.0%
7.0%
6.0%
5.0%
TIER 1 LEVERAGE RATIO(1)
9.2%
8.8%
16.0%
9.3%
Excluding PPP Loans (2)
9.6%
14.0%
9.1%
9.0%
4.0%
2017
2018
2019
2020
Q221
16.0%
14.0%
12.0%
TIER 1 RISK-BASED CAPITAL RATIO(1)
10.0%
10.9%
10.2%
9.8%
8.0%
6.0%
12.0%
CET1 CAPITAL RATIO(1)
14.2%
13.4%
10.0%
10.9%
10.2%
9.8%
8.0%
WELL
CAPITALIZED
6.0%
5.0%
4.0%
2017
2018
2019
2020
Q221
TOTAL RISK-BASED CAPITAL RATIO (1)
20.0%
18.0%
14.2%
16.0%
13.4%
17.5%
16.8%
14.0%
13.7%
13.4%
12.0%
WELL
CAPITALIZED
10.0%
11.4%
8.0%
8.0%
6.0%
4.0%
2017
2018
2019
2020
Q221
4.0%
2017
2018
2019
2020
Q221
$
(1) As of December 31, except where otherwise stated.
(2) Non-GAAP measure that management believes aids in the discussion of results. See Appendix for Non-GAAP reconciliation.
WELL
CAPITALIZED
6.5%
WELL
CAPITALIZED
10.0%
24
24View entire presentation