SmileDirectClub Investor Presentation Deck
●
●
Q1 2023 results.
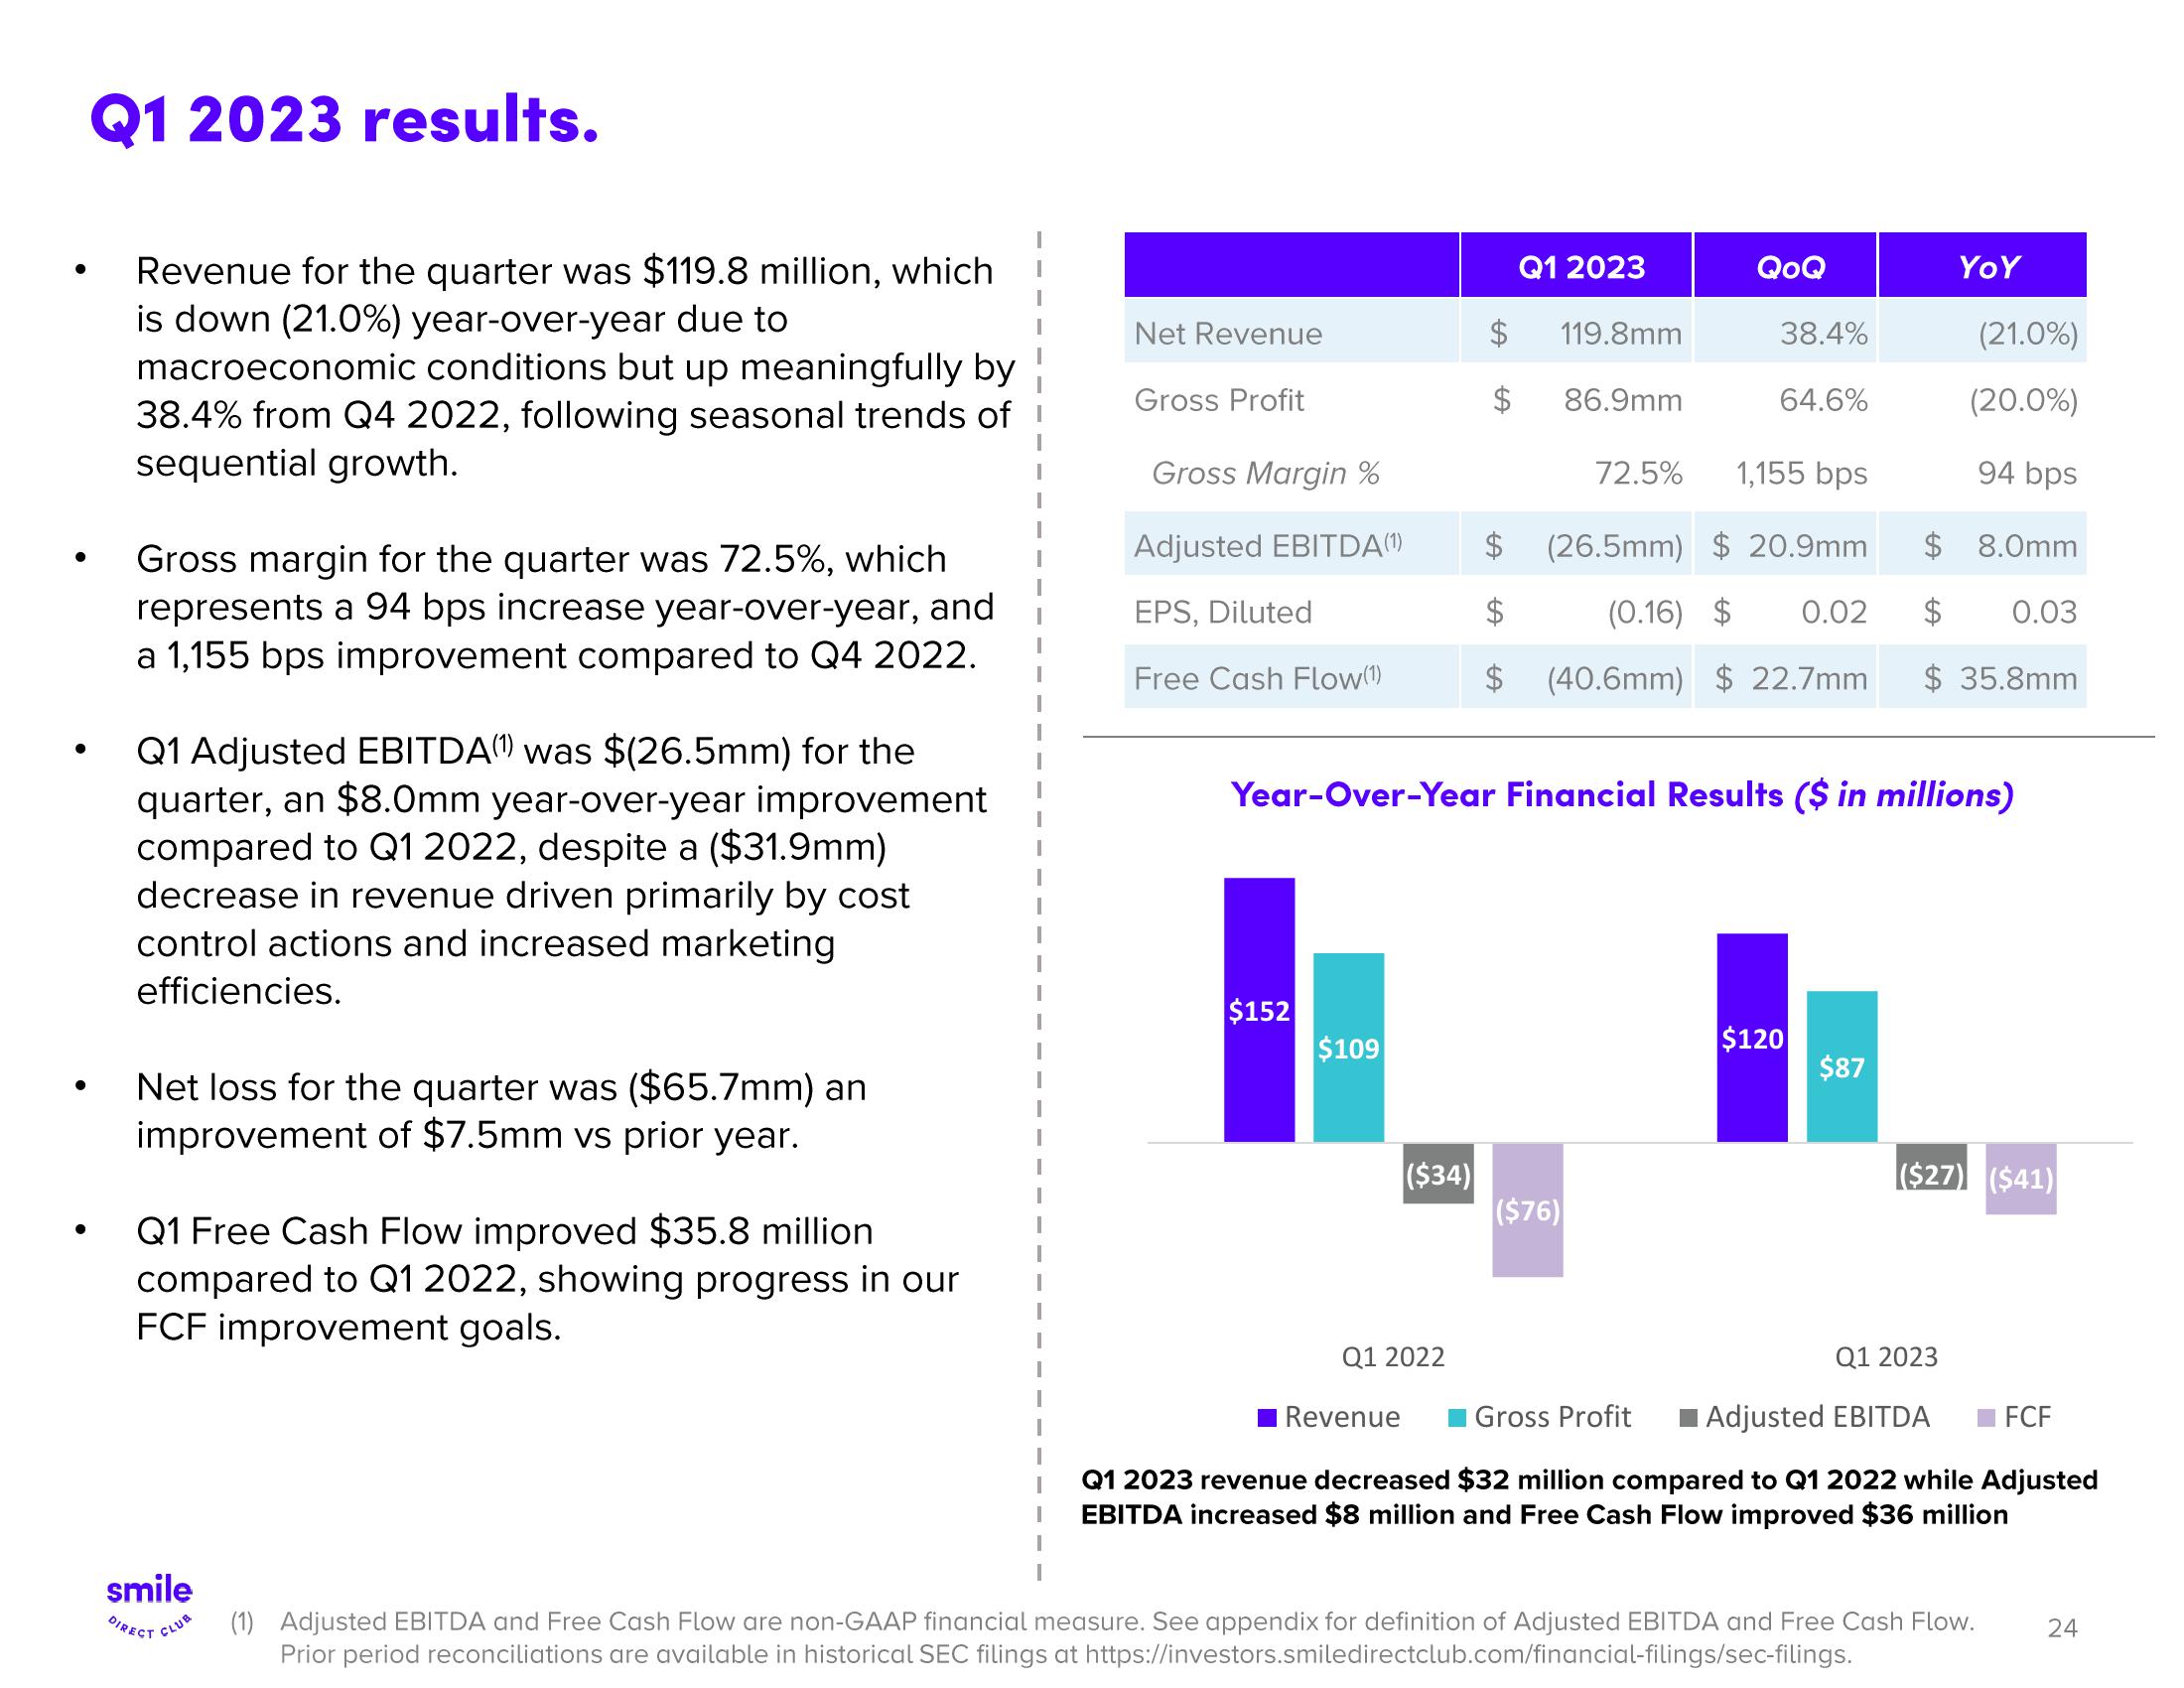
Revenue for the quarter was $119.8 million, which
is down (21.0%) year-over-year due to
macroeconomic conditions but up meaningfully by
38.4% from Q4 2022, following seasonal trends of
sequential growth.
Gross margin for the quarter was 72.5%, which
represents a 94 bps increase year-over-year, and
a 1,155 bps improvement compared to Q4 2022.
Q1 Adjusted EBITDA) was $(26.5mm) for the
quarter, an $8.0mm year-over-year improvement
compared to Q1 2022, despite a ($31.9mm)
decrease in revenue driven primarily by cost
control actions and increased marketing
efficiencies.
Net loss for the quarter was ($65.7mm) an
improvement of $7.5mm vs prior year.
Q1 Free Cash Flow improved $35.8 million
compared to Q1 2022, showing progress in our
FCF improvement goals.
smile
DIRECT CLUB
Net Revenue
Gross Profit
Gross Margin %
Adjusted EBITDA (1)
EPS, Diluted
Free Cash Flow(1)
$152
$109
($34)
Q1 2022
$
Revenue
$
$
Q1 2023
119.8mm
86.9mm
QoQ
(21.0%)
(20.0%)
94 bps
$
8.0mm
(0.16) $ 0.02 $ 0.03
$ 35.8mm
72.5%
Year-Over-Year Financial Results ($ in millions)
($76)
38.4%
1,155 bps
(26.5mm) $20.9mm
64.6%
(40.6mm) $ 22.7mm
$120
YOY
$87
($27) ($41)
Q1 2023
Gross Profit ■Adjusted EBITDA
FCF
Q1 2023 revenue decreased $32 million compared to Q1 2022 while Adjusted
EBITDA increased $8 million and Free Cash Flow improved $36 million
(1) Adjusted EBITDA and Free Cash Flow are non-GAAP financial measure. See appendix for definition of Adjusted EBITDA and Free Cash Flow. 24
Prior period reconciliations are available in historical SEC filings at https://investors.smiledirectclub.com/financial-filings/sec-filings.View entire presentation