Frontier IPO Presentation Deck
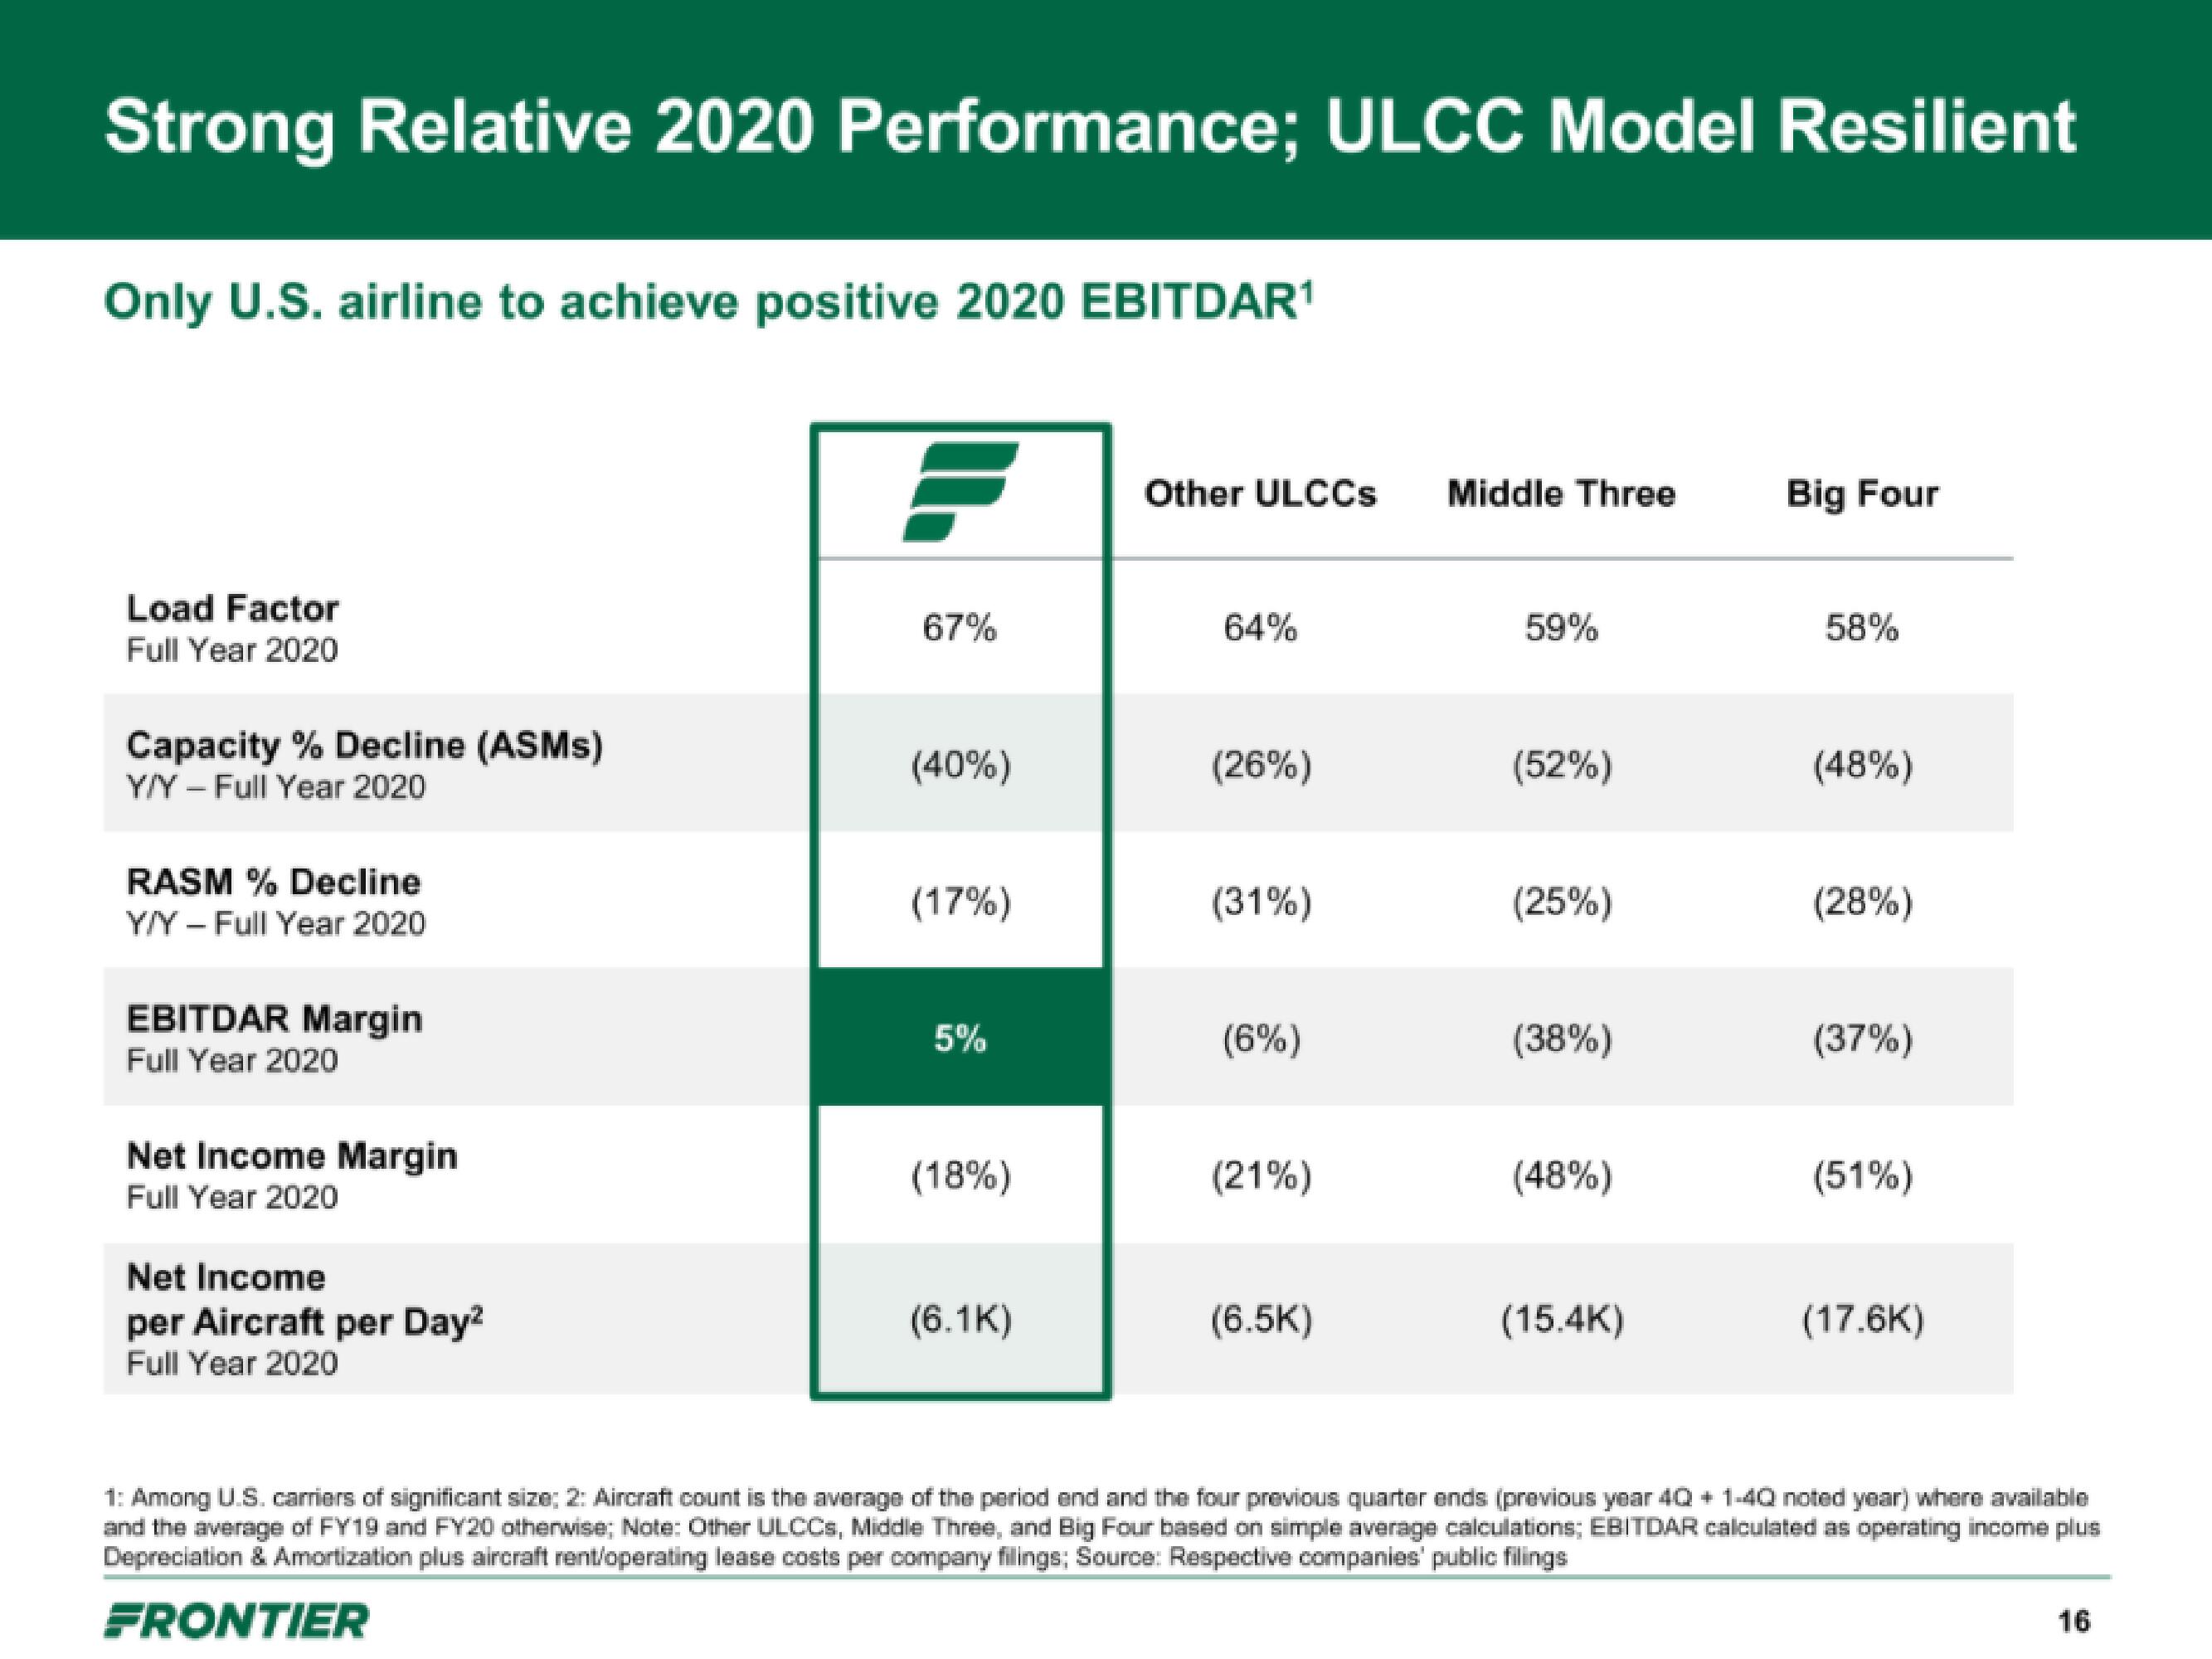
Strong Relative 2020 Performance; ULCC Model Resilient
Only U.S. airline to achieve positive 2020 EBITDAR¹
Load Factor
Full Year 2020
Capacity % Decline (ASMS)
Y/Y - Full Year 2020
RASM % Decline
Y/Y - Full Year 2020
EBITDAR Margin
Full Year 2020
Net Income Margin
Full Year 2020
Net Income
per Aircraft per Day²
Full Year 2020
67%
(40%)
(17%)
5%
(18%)
(6.1K)
Other ULCCs Middle Three
64%
(26%)
(31%)
(6%)
(21%)
(6.5K)
59%
(52%)
(25%)
(38%)
(48%)
(15.4K)
Big Four
58%
(48%)
(28%)
(37%)
(51%)
(17.6K)
1: Among U.S. carriers of significant size; 2: Aircraft count is the average of the period end and the four previous quarter ends (previous year 4Q + 1-40 noted year) where available
and the average of FY19 and FY20 otherwise; Note: Other ULCCS, Middle Three, and Big Four based on simple average calculations; EBITDAR calculated as operating income plus
Depreciation & Amortization plus aircraft rent/operating lease costs per company filings; Source: Respective companies' public filings
FRONTIER
16View entire presentation