Flutter Results Presentation Deck
●
Pro forma
●
Appendices
●
●
International
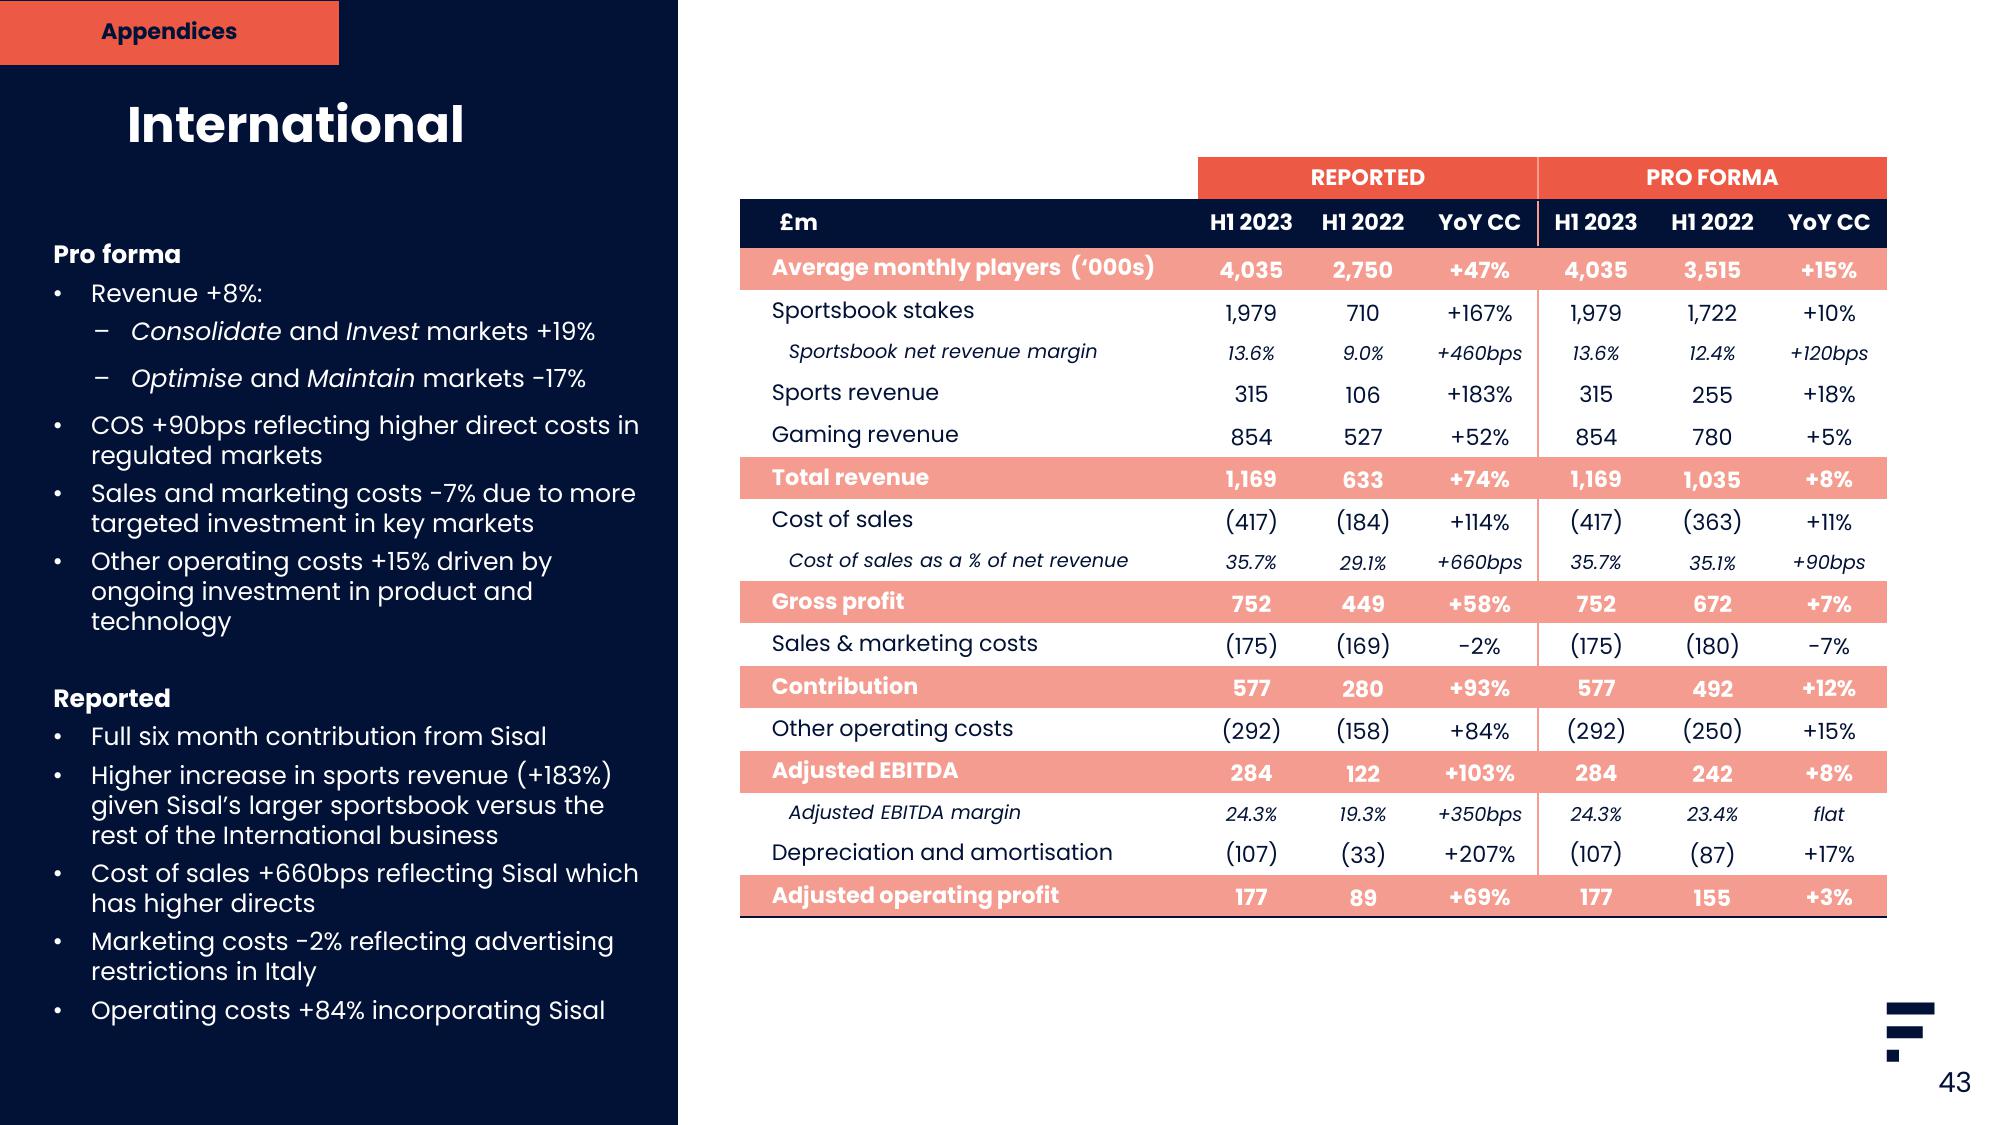
Revenue +8%:
Consolidate and Invest markets +19%
Optimise and Maintain markets -17%
COS +90bps reflecting higher direct costs in
regulated markets
Sales and marketing costs -7% due to more
targeted investment in key markets
-
Reported
Full six month contribution from Sisal
Other operating costs +15% driven by
ongoing investment in product and
technology
Higher increase in sports revenue (+183%)
given Sisal's larger sportsbook versus the
rest of the International business
Cost of sales +660bps reflecting Sisal which
has higher directs
Marketing costs -2% reflecting advertising
restrictions in Italy
Operating costs +84% incorporating Sisal
£m
Average monthly players ('000s)
Sportsbook stakes
Sportsbook net revenue margin
Sports revenue
Gaming revenue
Total revenue
Cost of sales
Cost of sales as a % of net revenue
Gross profit
Sales & marketing costs
Contribution
Other operating costs
Adjusted EBITDA
Adjusted EBITDA margin
Depreciation and amortisation
Adjusted operating profit
REPORTED
Hồ 2023 H12022
2,750
710
9.0%
106
527
633
4,035
1,979
13.6%
315
854
1,169
(417)
35.7%
752
449
(175)
(169)
577
280
(292) (158)
284
24.3%
122
19.3%
(107) (33)
177
89
YOY CC
H12022
3,515
1,722
12.4%
255
780
+5%
1,035
+8%
(363)
+11%
+90bps
35.1%
672
(175) (180)
+7%
-7%
+12%
492
+660bps 35.7%
+58% 752
-2%
+93%
+84%
+103%
+350bps
+207% (107) (87) +17%
577
(292) (250)
284
24.3%
242
23.4%
+15%
+8%
flat
+69%
177
155
+3%
Hồ 2023
+47% 4,035
+167% 1,979
+460bps 13.6%
+183%
315
+52%
854
+74% 1,169
(184) +114% (417)
29.1%
PRO FORMA
YOY CC
+15%
+10%
+120bps
+18%
F
II.
43View entire presentation