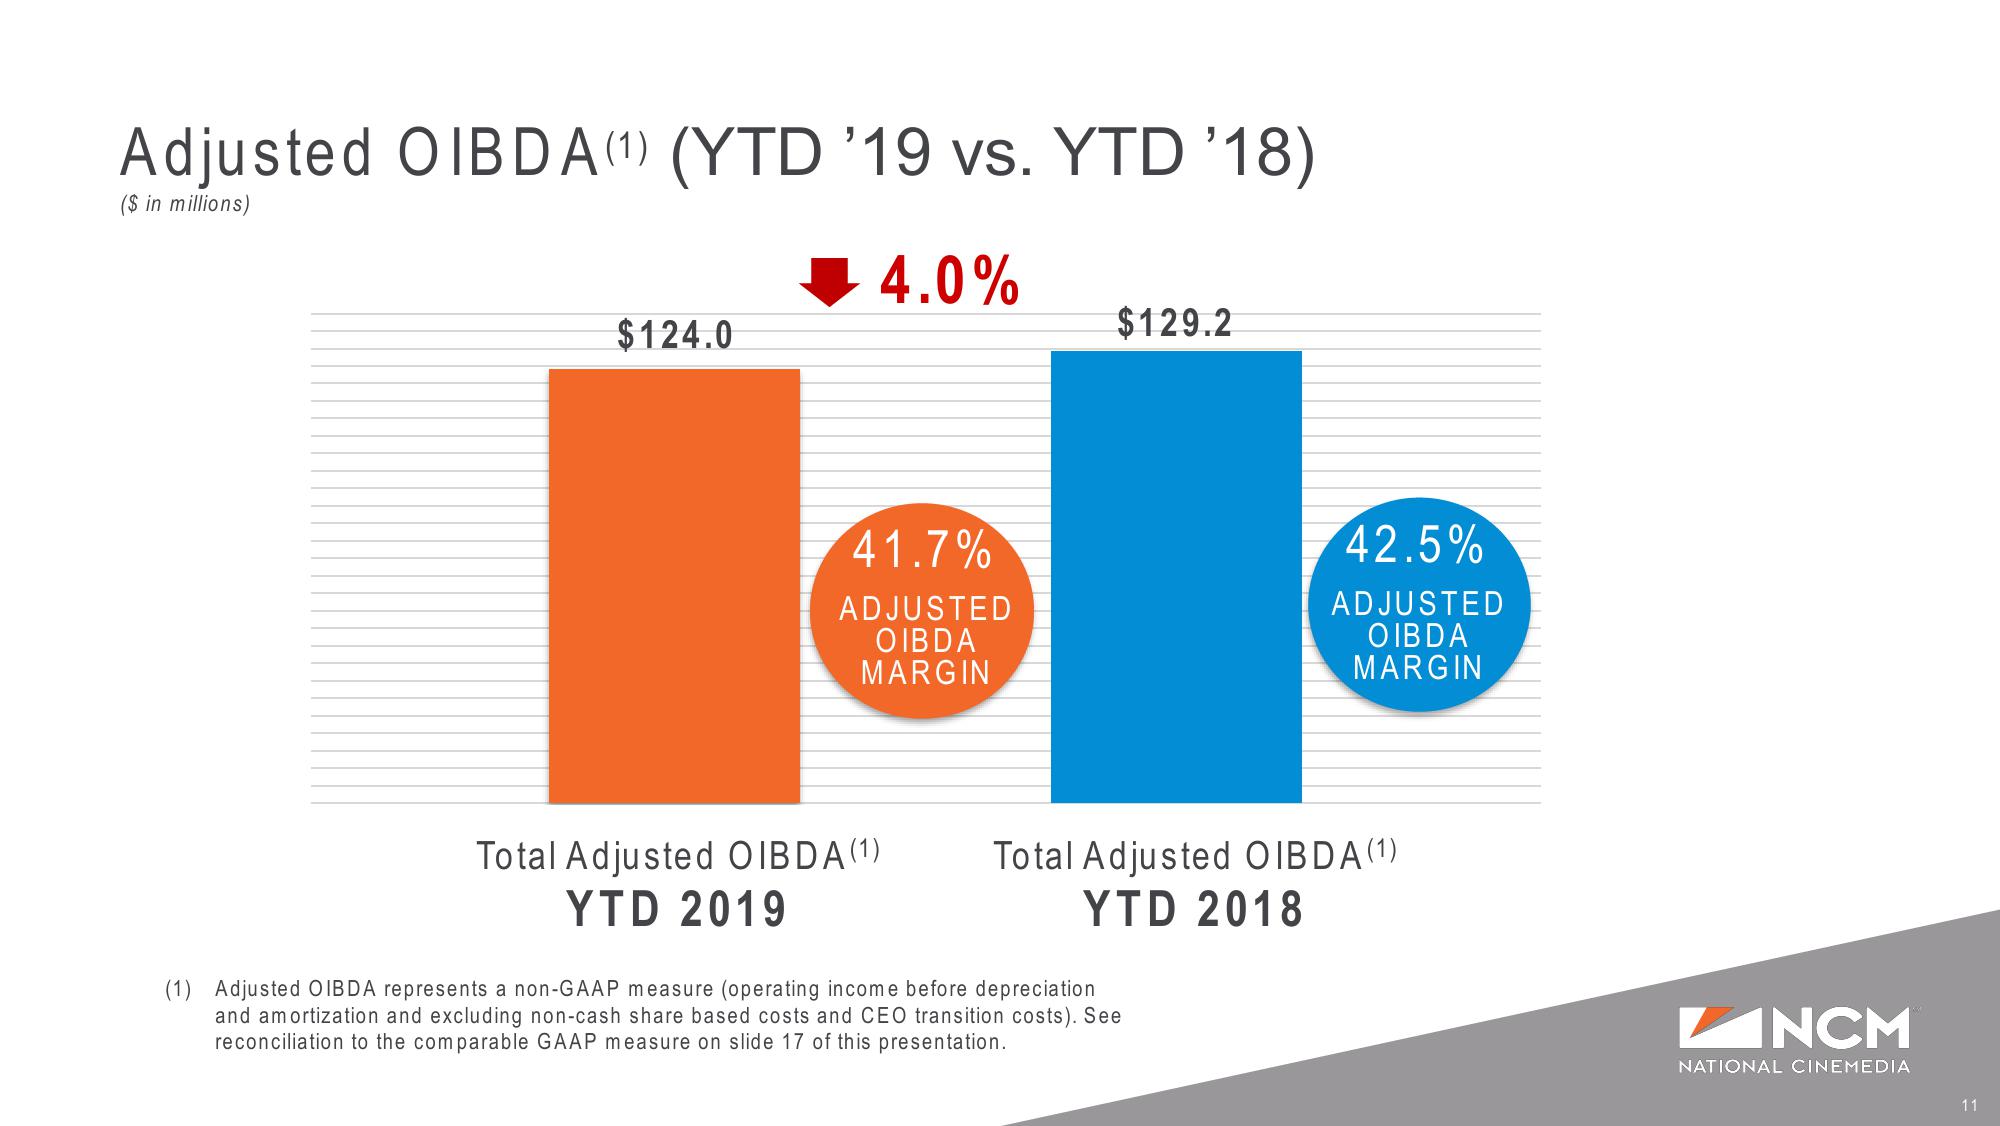
Q3’19 Earnings Supplemental Presentation
Categories
Finance PresentationsTechnology PresentationsBanking PresentationsInformation Technology PresentationsOil and Energy PresentationsInternet PresentationsMining and Metals PresentationsCommunications PresentationsReal Estate PresentationsBiotechnology PresentationsAutomotive PresentationsMedical PresentationsRetail PresentationsEnergy Presentations