Maersk Results Presentation Deck
Maersk Group
- Interim Report 03 2015
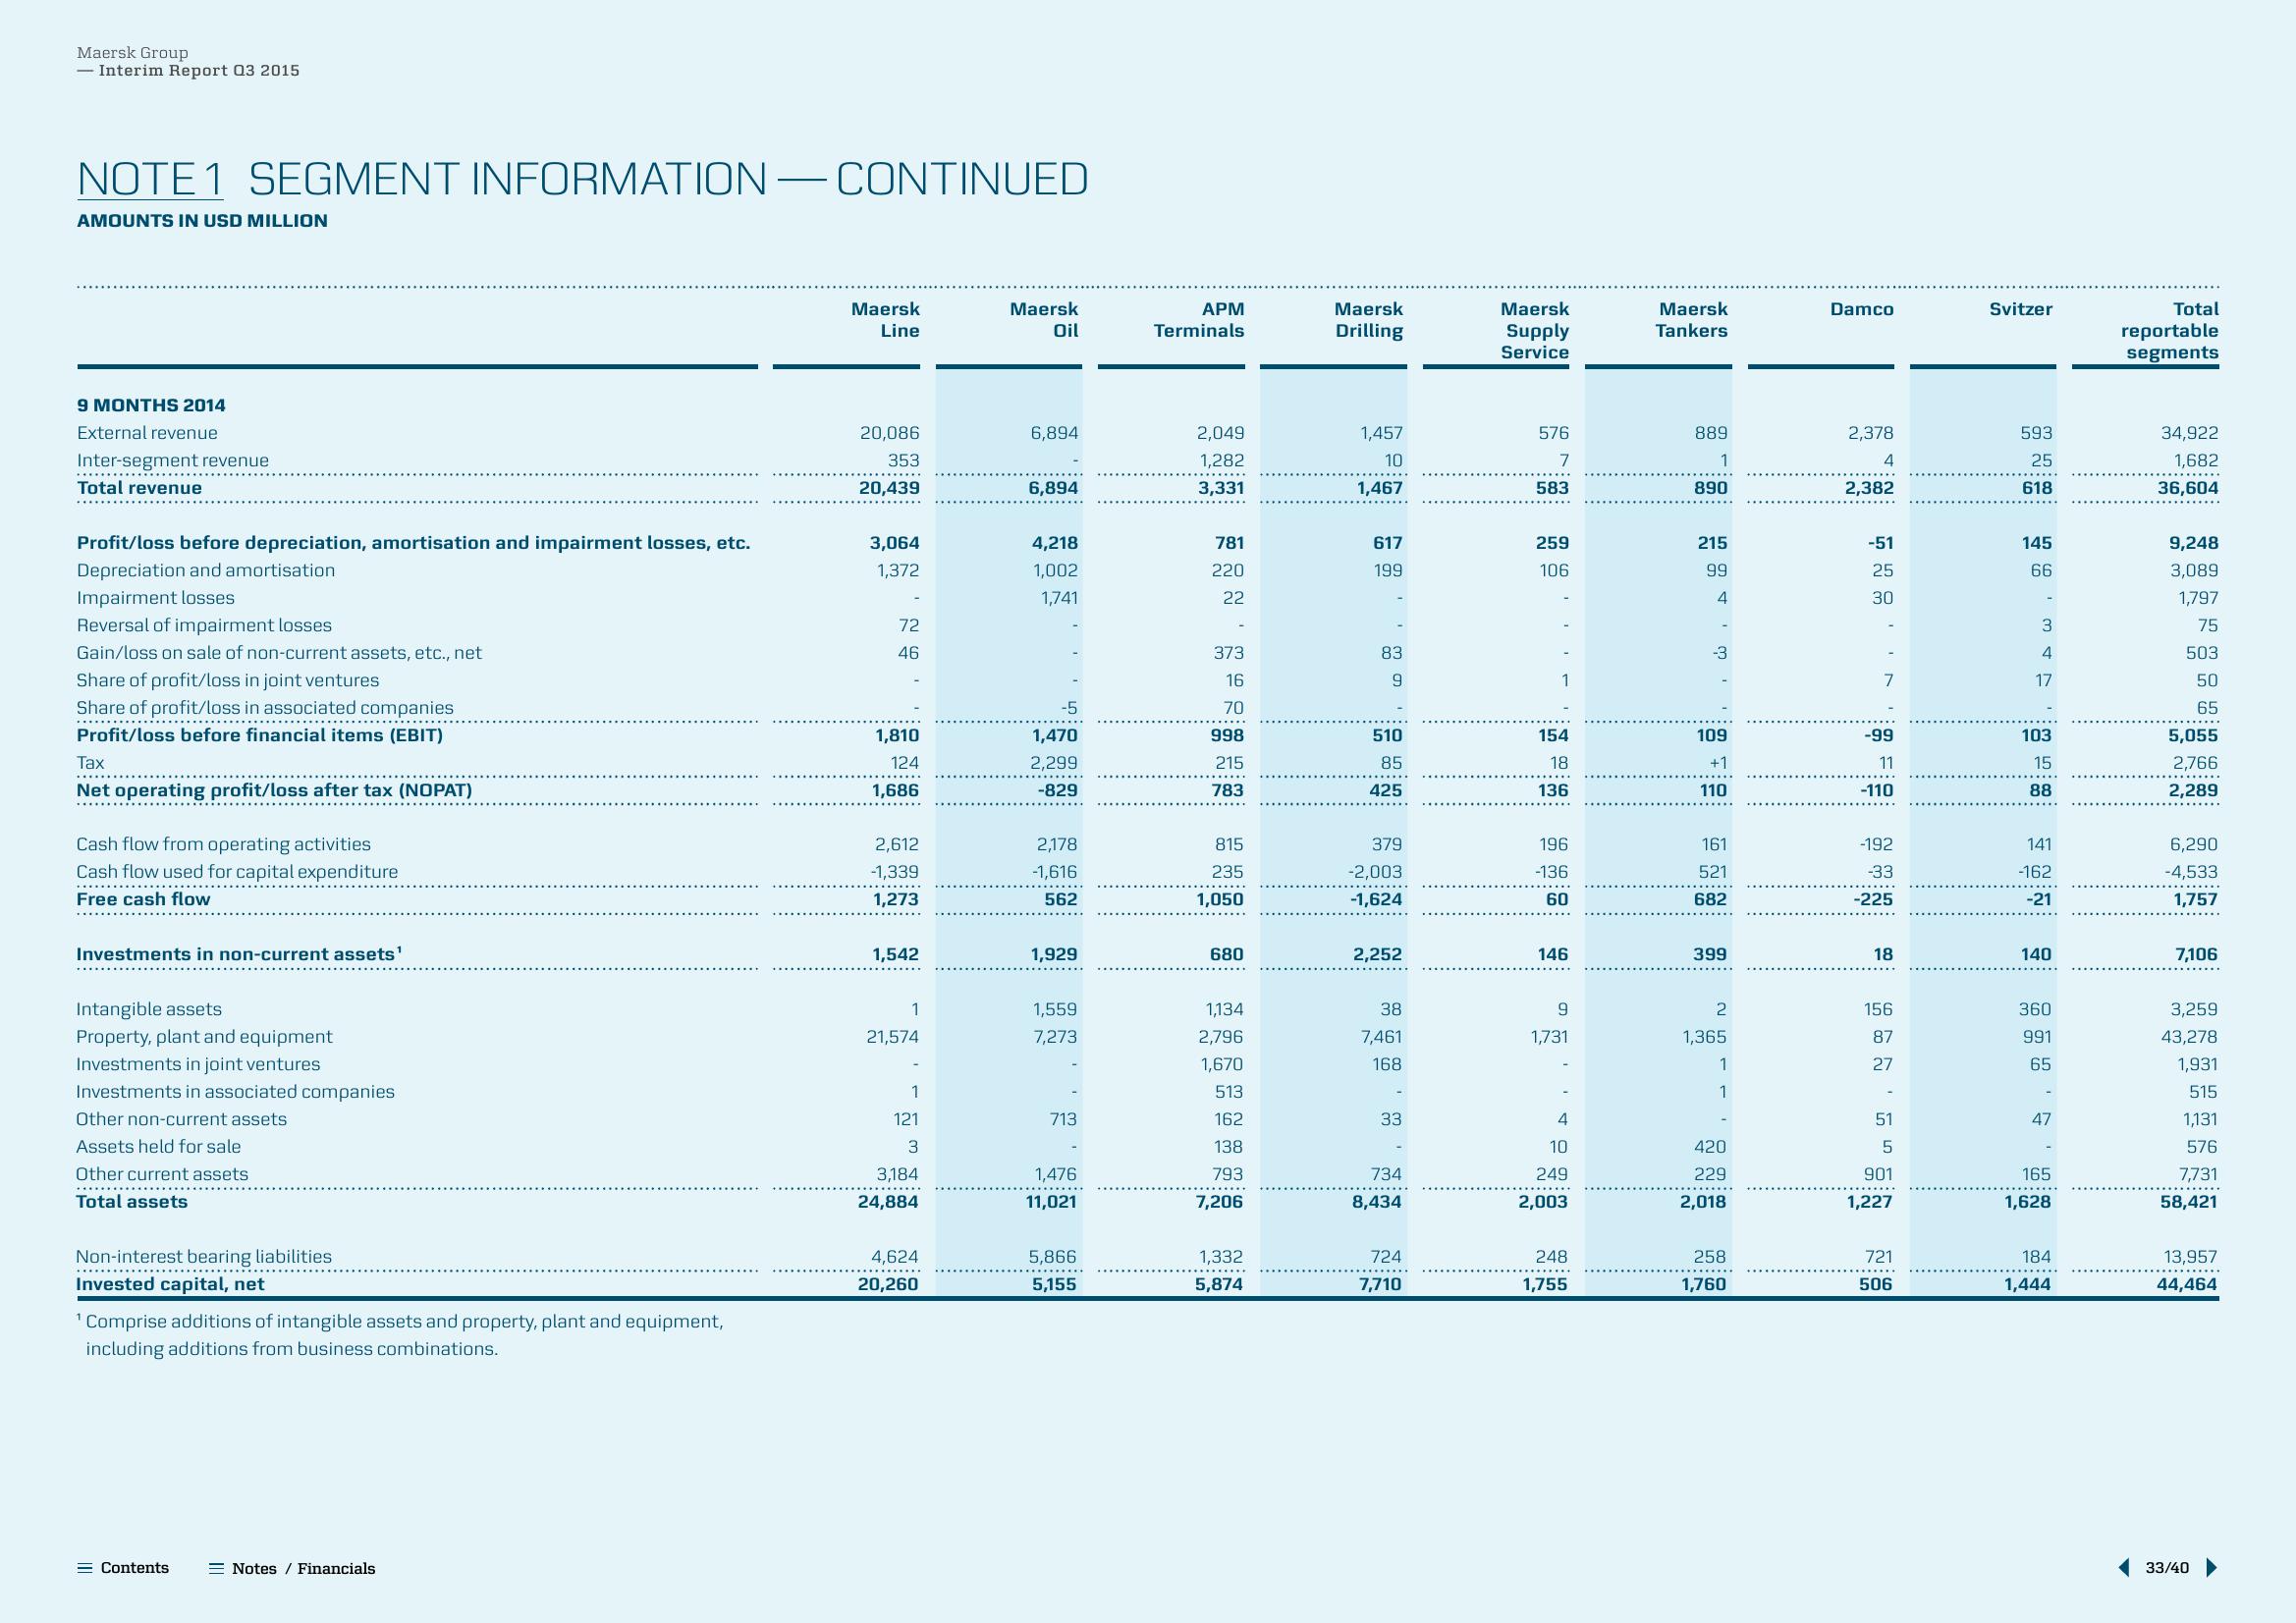
NOTE 1 SEGMENT INFORMATION — CONTINUED
AMOUNTS IN USD MILLION
9 MONTHS 2014
External revenue
Inter-segment revenue
Total revenue
Profit/loss before depreciation, amortisation and impairment losses, etc.
Depreciation and amortisation
Impairment losses
Reversal of impairment losses
Gain/loss on sale of non-current assets, etc., net
Share of profit/loss in joint ventures
Share of profit/loss in associated companies
Profit/loss before financial items (EBIT)
..……….……..…………………….
Tax
Net operating profit/loss after tax (NOPAT)
Cash flow from operating activities
Cash flow used for capital expenditure
Free cash flow
Investments in non-current assets¹
Intangible assets
Property, plant and equipment
Investments in joint ventures
Investments in associated companies
Other non-current assets
Assets held for sale
Other current assets
Total assets
Non-interest bearing liabilities
Invested capital, net
¹ Comprise additions of intangible assets and property, plant and equipment,
including additions from business combinations.
= Contents
Notes / Financials
Maersk
Line
20,086
353
20,439
3,064
1,372
72
46
1,810
124
1,686
2,612
-1,339
1,273
1,542
1
21,574
1
121
3
3,184
24,884
4,624
20,260
Maersk
Oil
6,894
6,894
4,218
1,002
1,741
-5
1,470
2,299
-829
2,178
-1,616
562
1,929
1,559
7,273
713
1,476
11,021
5,866
5,155
APM
Terminals
2,049
1,282
3,331
781
220
22
373
16
70
998
215
783
815
235
1,050
680
1,134
2,796
1,670
513
162
138
793
7,206
1,332
5,874
Maersk
Drilling
1,457
10
1,467
617
199
83
9
510
85
425
379
-2,003
-1,624
2,252
38
7,461
168
33
734
8,434
724
7,710
Maersk
Supply
Service
576
7
583
259
106
1
154
18
136
196
-136
60
146
9
1,731
4
10
249
2,003
248
1,755
Maersk
Tankers
889
1
890
215
99
4
-3
109
+1
110
161
521
682
399
2
1,365
1
1
420
229
2,018
258
1,760
Damco
2,378
4
2,382
-51
25
30
7
-99
11
-110
-192
-33
-225
18
156
87
27
51
5
901
1,227
721
506
Svitzer
593
25
618
145
66
3
4
17
103
15
88
141
-162
-21
140
360
991
65
47
165
1,628
184
1,444
Total
reportable
segments
34,922
1,682
36,604
9,248
3,089
1,797
75
503
50
65
5,055
2,766
2,289
6,290
-4,533
1,757
7,106
3,259
43,278
1,931
515
1,131
576
7,731
58,421
13,957
44,464
33/40View entire presentation