UBS Results Presentation Deck
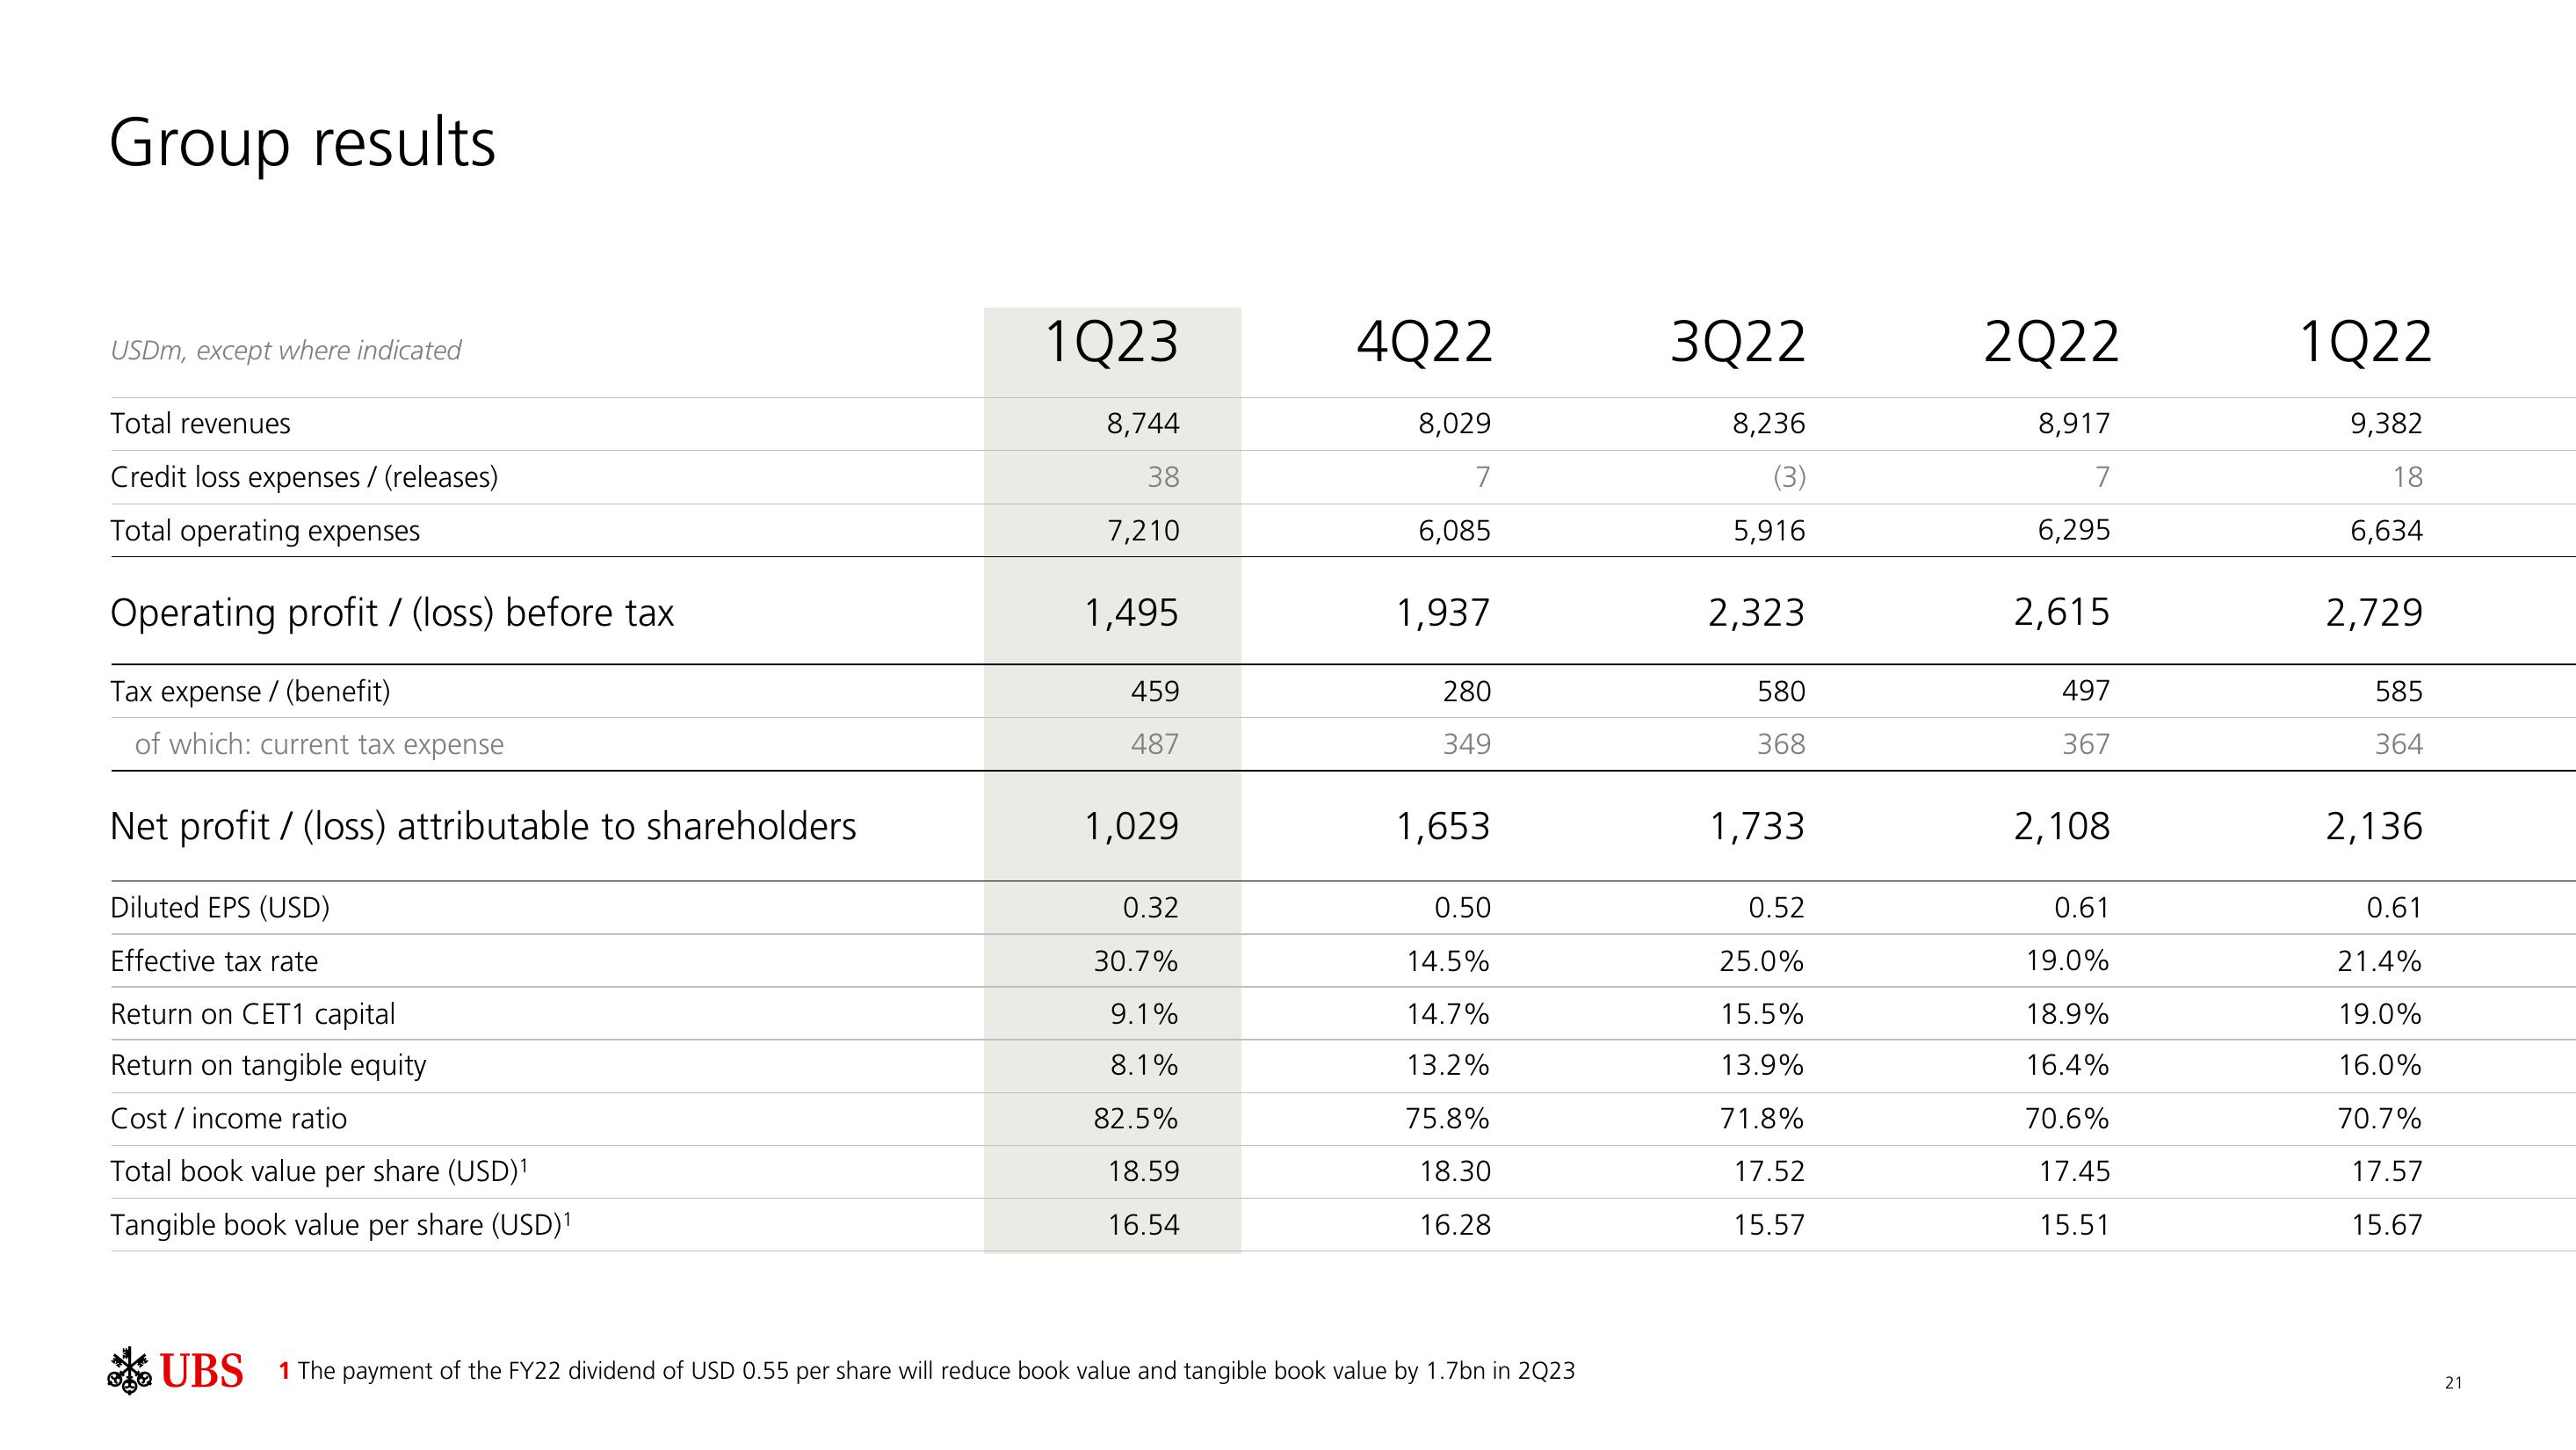
Group results
USDm, except where indicated
Total revenues
Credit loss expenses/ (releases)
Total operating expenses
Operating profit/ (loss) before tax
Tax expense / (benefit)
of which: current tax expense
Net profit/ (loss) attributable to shareholders
Diluted EPS (USD)
Effective tax rate
Return on CET1 capital
Return on tangible equity
Cost / income ratio
Total book value per share (USD)¹
Tangible book value per share (USD)¹
1Q23
8,744
38
7,210
1,495
459
487
1,029
0.32
30.7%
9.1%
8.1%
82.5%
18.59
16.54
4Q22
8,029
7
6,085
1,937
280
349
1,653
0.50
14.5%
14.7%
13.2%
75.8%
18.30
16.28
UBS 1 The payment of the FY22 dividend of USD 0.55 per share will reduce book value and tangible book value by 1.7bn in 2Q23
3Q22
8,236
(3)
5,916
2,323
580
368
1,733
0.52
25.0%
15.5%
13.9%
71.8%
17.52
15.57
2Q22
8,917
7
6,295
2,615
497
367
2,108
0.61
19.0%
18.9%
16.4%
70.6%
17.45
15.51
1Q22
9,382
18
6,634
2,729
585
364
2,136
0.61
21.4%
19.0%
16.0%
70.7%
17.57
15.67
21View entire presentation