Barclays Capital 2010 Global Financial Services Conference
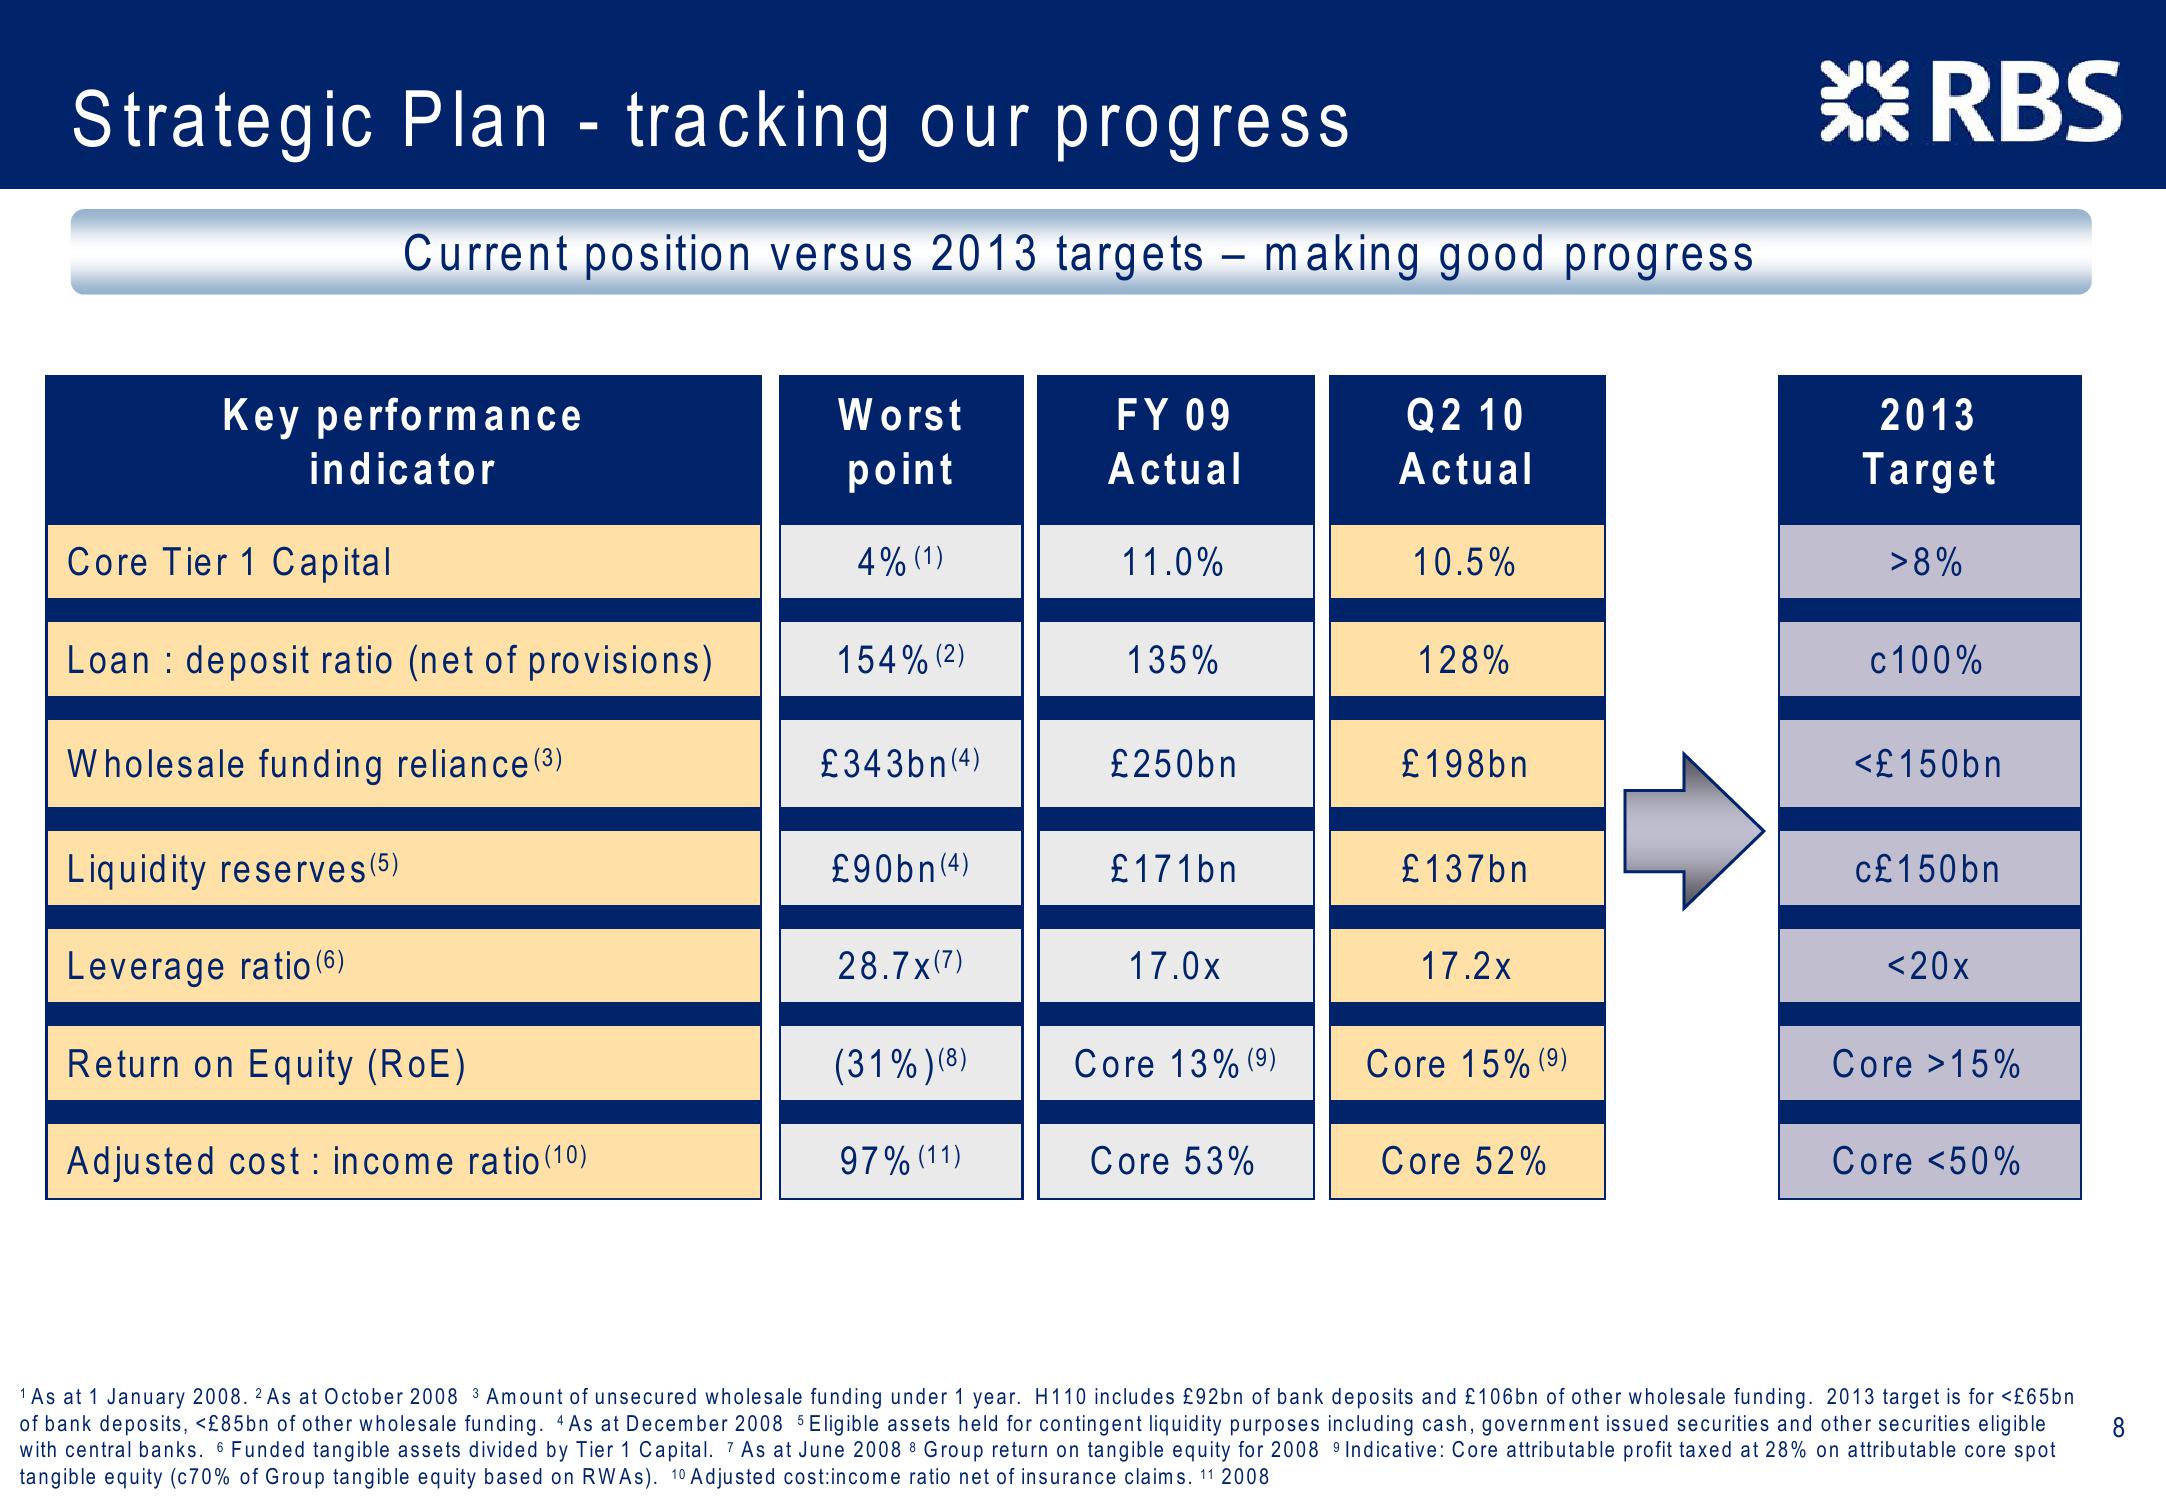
Strategic Plan - tracking our progress
Current position versus 2013 targets - making good progress
Key performance
indicator
XRBS
2013
Target
Worst
point
FY 09
Actual
Q2 10
Actual
Core Tier 1 Capital
4% (1)
11.0%
10.5%
>8%
Loan deposit ratio (net of provisions)
154% (2)
135%
128%
c100%
Wholesale funding reliance (3)
£343bn (4)
£250bn
£198bn
<£150bn
Liquidity reserves (5)
£90bn (4)
£171bn
£137bn
c£150bn
Leverage ratio (6)
28.7x(7)
17.0x
17.2x
<20x
Return on Equity (RoE)
(31%)(8)
Core 13% (9)
Core 15% (9)
Core >15%
Adjusted cost income ratio (10)
97% (11)
Core 53%
Core 52%
Core <50%
1 As at 1 January 2008. 2 As at October 2008 3 Amount of unsecured wholesale funding under 1 year. H110 includes £92bn of bank deposits and £106bn of other wholesale funding. 2013 target is for <£65bn
of bank deposits, <£85bn of other wholesale funding. 4 As at December 2008 5 Eligible assets held for contingent liquidity purposes including cash, government issued securities and other securities eligible
with central banks. 6 Funded tangible assets divided by Tier 1 Capital. 7 As at June 2008 8 Group return on tangible equity for 2008 9 Indicative: Core attributable profit taxed at 28% on attributable core spot
tangible equity (c70% of Group tangible equity based on RWAs). 10 Adjusted cost:income ratio net of insurance claims. 11 2008
8View entire presentation