Corecentric SPAC
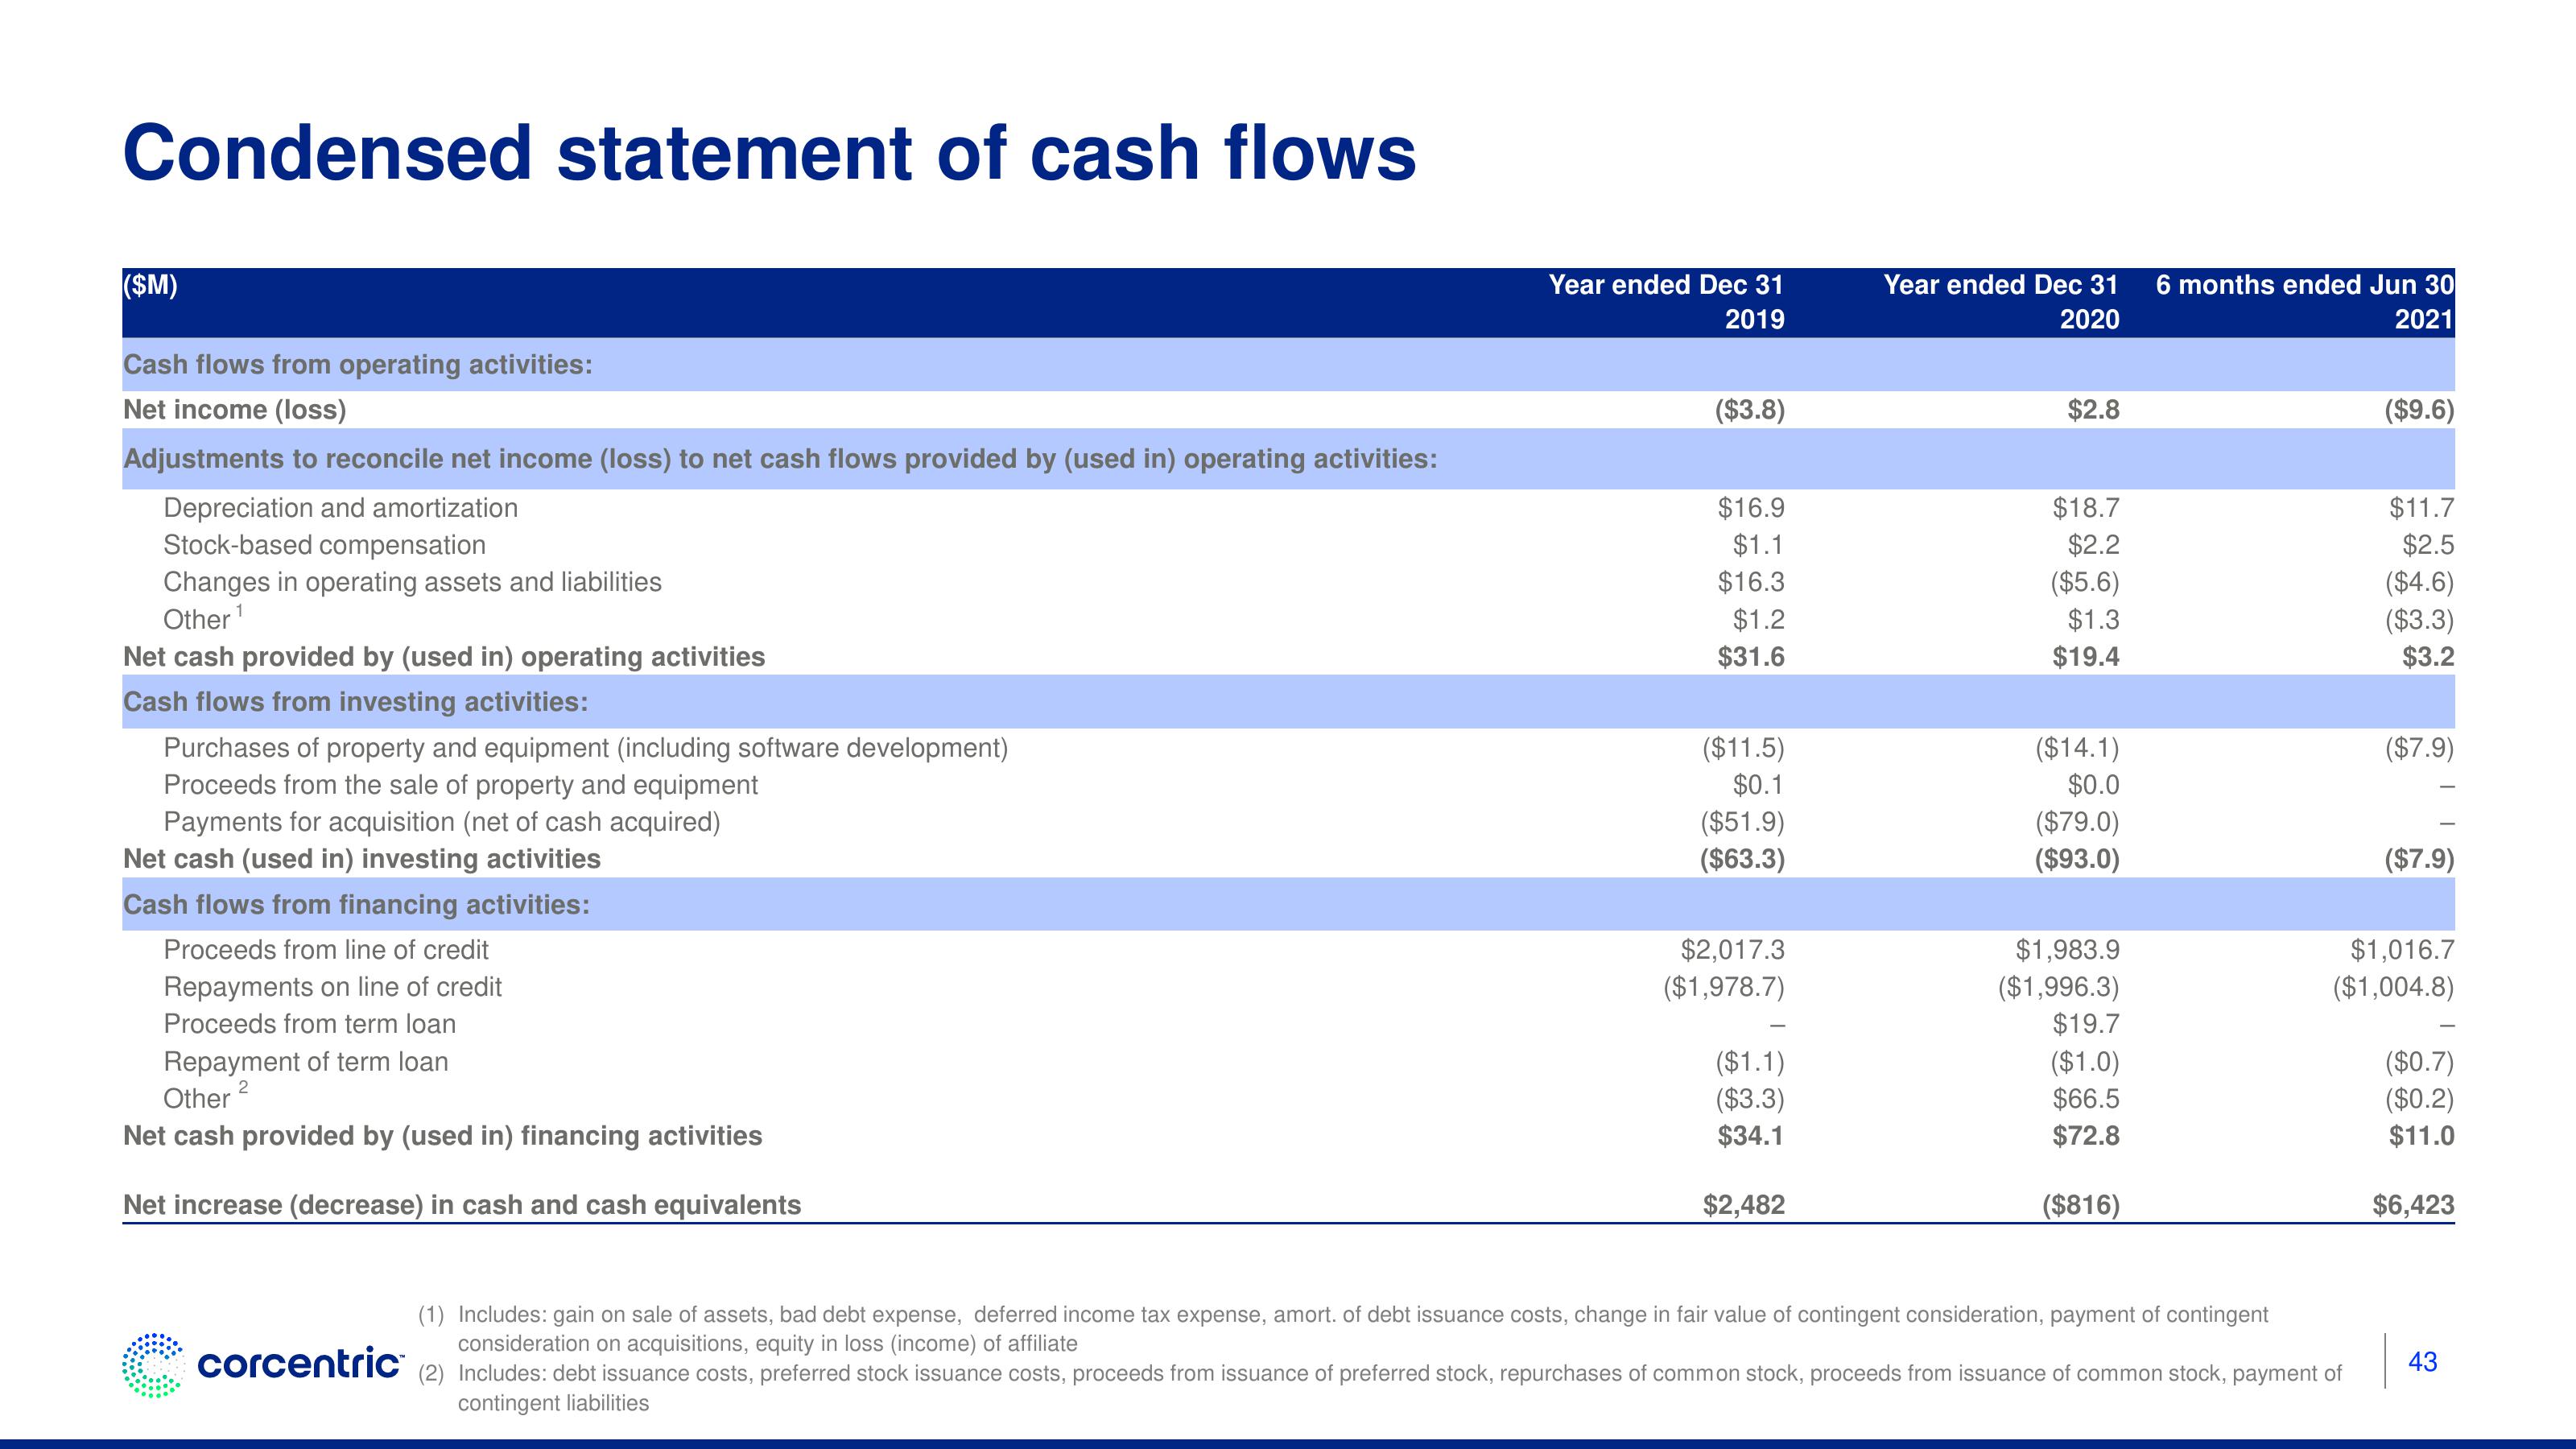
Condensed statement of cash flows
($M)
Cash flows from operating activities:
Net income (loss)
Adjustments to reconcile net income (loss) to net cash flows provided by (used in) operating activities:
Depreciation and amortization
Stock-based compensation
Changes in operating assets and liabilities
Other ¹
Net cash provided by (used in) operating activities
Cash flows from investing activities:
Purchases of property and equipment (including software development)
Proceeds from the sale of property and equipment
Payments for acquisition (net of cash acquired)
Net cash (used in) investing activities
Cash flows from financing activities:
Proceeds from line of credit
Repayments on line of credit
Proceeds from term loan
Repayment of term loan
2
Other ²
Net cash provided by (used in) financing activities
Net increase (decrease) in cash and cash equivalents
corcentric
Year ended Dec 31
2019
($3.8)
$16.9
$1.1
$16.3
$1.2
$31.6
($11.5)
$0.1
($51.9)
($63.3)
$2,017.3
($1,978.7)
($1.1)
($3.3)
$34.1
$2,482
Year ended Dec 31
2020
$2.8
$18.7
$2.2
($5.6)
$1.3
$19.4
($14.1)
$0.0
($79.0)
($93.0)
$1,983.9
($1,996.3)
$19.7
($1.0)
$66.5
$72.8
($816)
6 months ended Jun 30
2021
($9.6)
(1) Includes: gain on sale of assets, bad debt expense, deferred income tax expense, amort. of debt issuance costs, change in fair value of contingent consideration, payment of contingent
consideration on acquisitions, equity in loss (income) of affiliate
(2) Includes: debt issuance costs, preferred stock issuance costs, proceeds from issuance of preferred stock, repurchases of common stock, proceeds from issuance of common stock, payment of
contingent liabilities
$11.7
$2.5
($4.6)
($3.3)
$3.2
($7.9)
($7.9)
$1,016.7
($1,004.8)
($0.7)
($0.2)
$11.0
$6,423
43View entire presentation