Inovalon Results Presentation Deck
Q2 2017 - Continued Sequential Improvement inovalon
Growth
$112
$110
$108
$106
$104
$102
$100
70%
Operating 65%
Leverage 60%
55%
50%
Continued 8%
Investment
6%
64.7%
$108.3
Gross Margin'
Q1 2017
7.0%
Revenue ($M)
Q1 2017
Q1 2017 Q2 2017
66.4%
Sales & Marketing 2
8.0%
Q2 2017
+2.1%
25%
20%
15%
10%
$110.6
22%
20%
18%
16%
14%
12%
10%
Q2 2017
3
Adj. EBITDA Margin ³
23.0%
Q1 2017
25.1%
Investment in Innovation²
16.3%
Q2 2017
19.8%
Q1 2017 Q2 2017
1: Gross Margin defined as Revenue less Cost of Revenue, as a percentage of Revenue.
2: Adj. EBITDA Margin, Sales & Marketing, and Investment in Innovation represent profit/expense as a percentage of revenue.
INOV Q2 2017 Earnings Presentation Supplement (8.2.17) v1.0.0
4
1
#
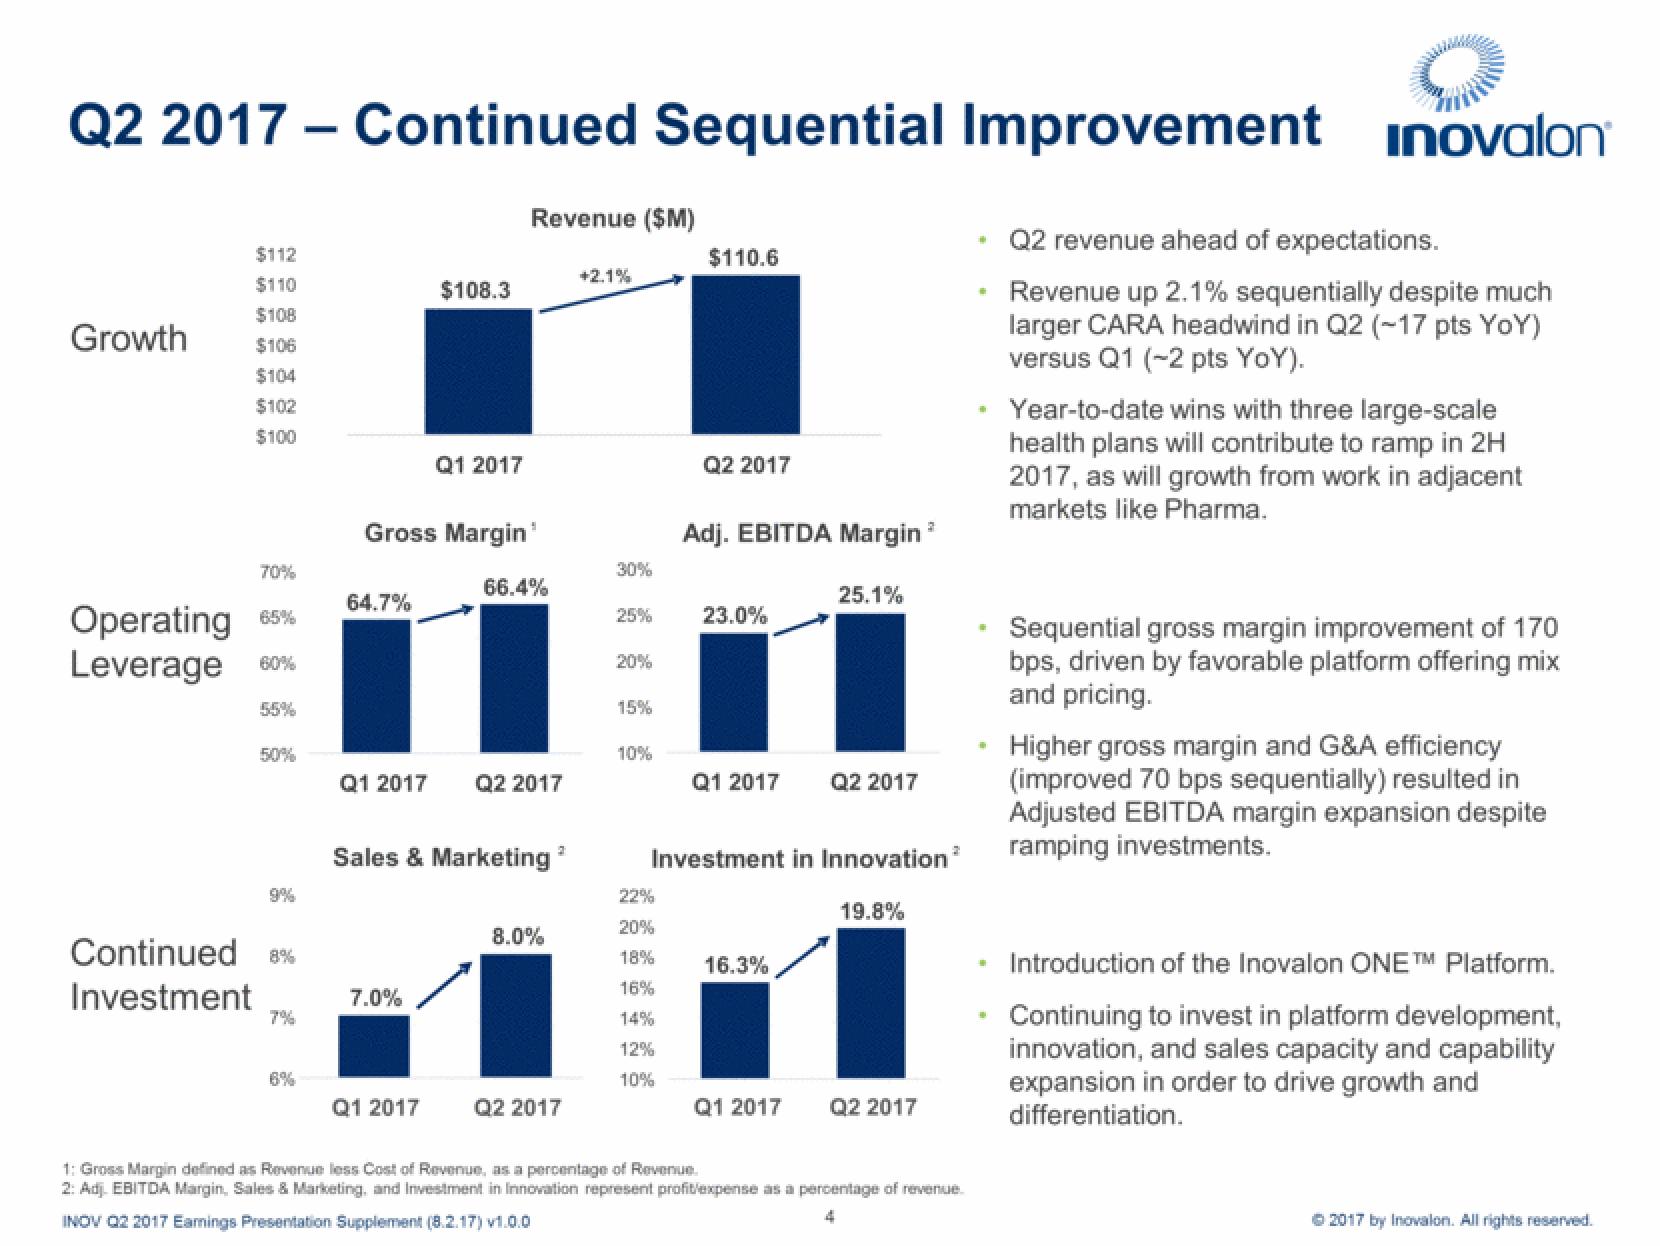
Q2 revenue ahead of expectations.
Revenue up 2.1% sequentially despite much
larger CARA headwind in Q2 (-17 pts YoY)
versus Q1 (-2 pts YoY).
Year-to-date wins with three large-scale
health plans will contribute to ramp in 2H
2017, as will growth from work in adjacent
markets like Pharma.
Sequential gross margin improvement of 170
bps, driven by favorable platform offering mix
and pricing.
Higher gross margin and G&A efficiency
(improved 70 bps sequentially) resulted in
Adjusted EBITDA margin expansion despite
ramping investments.
Introduction of the Inovalon ONE™ Platform.
Continuing to invest in platform development,
innovation, and sales capacity and capability
expansion in order to drive growth and
differentiation.
© 2017 by Inovalon. All rights reserved.View entire presentation