LandSea Homes Investor Presentation
39
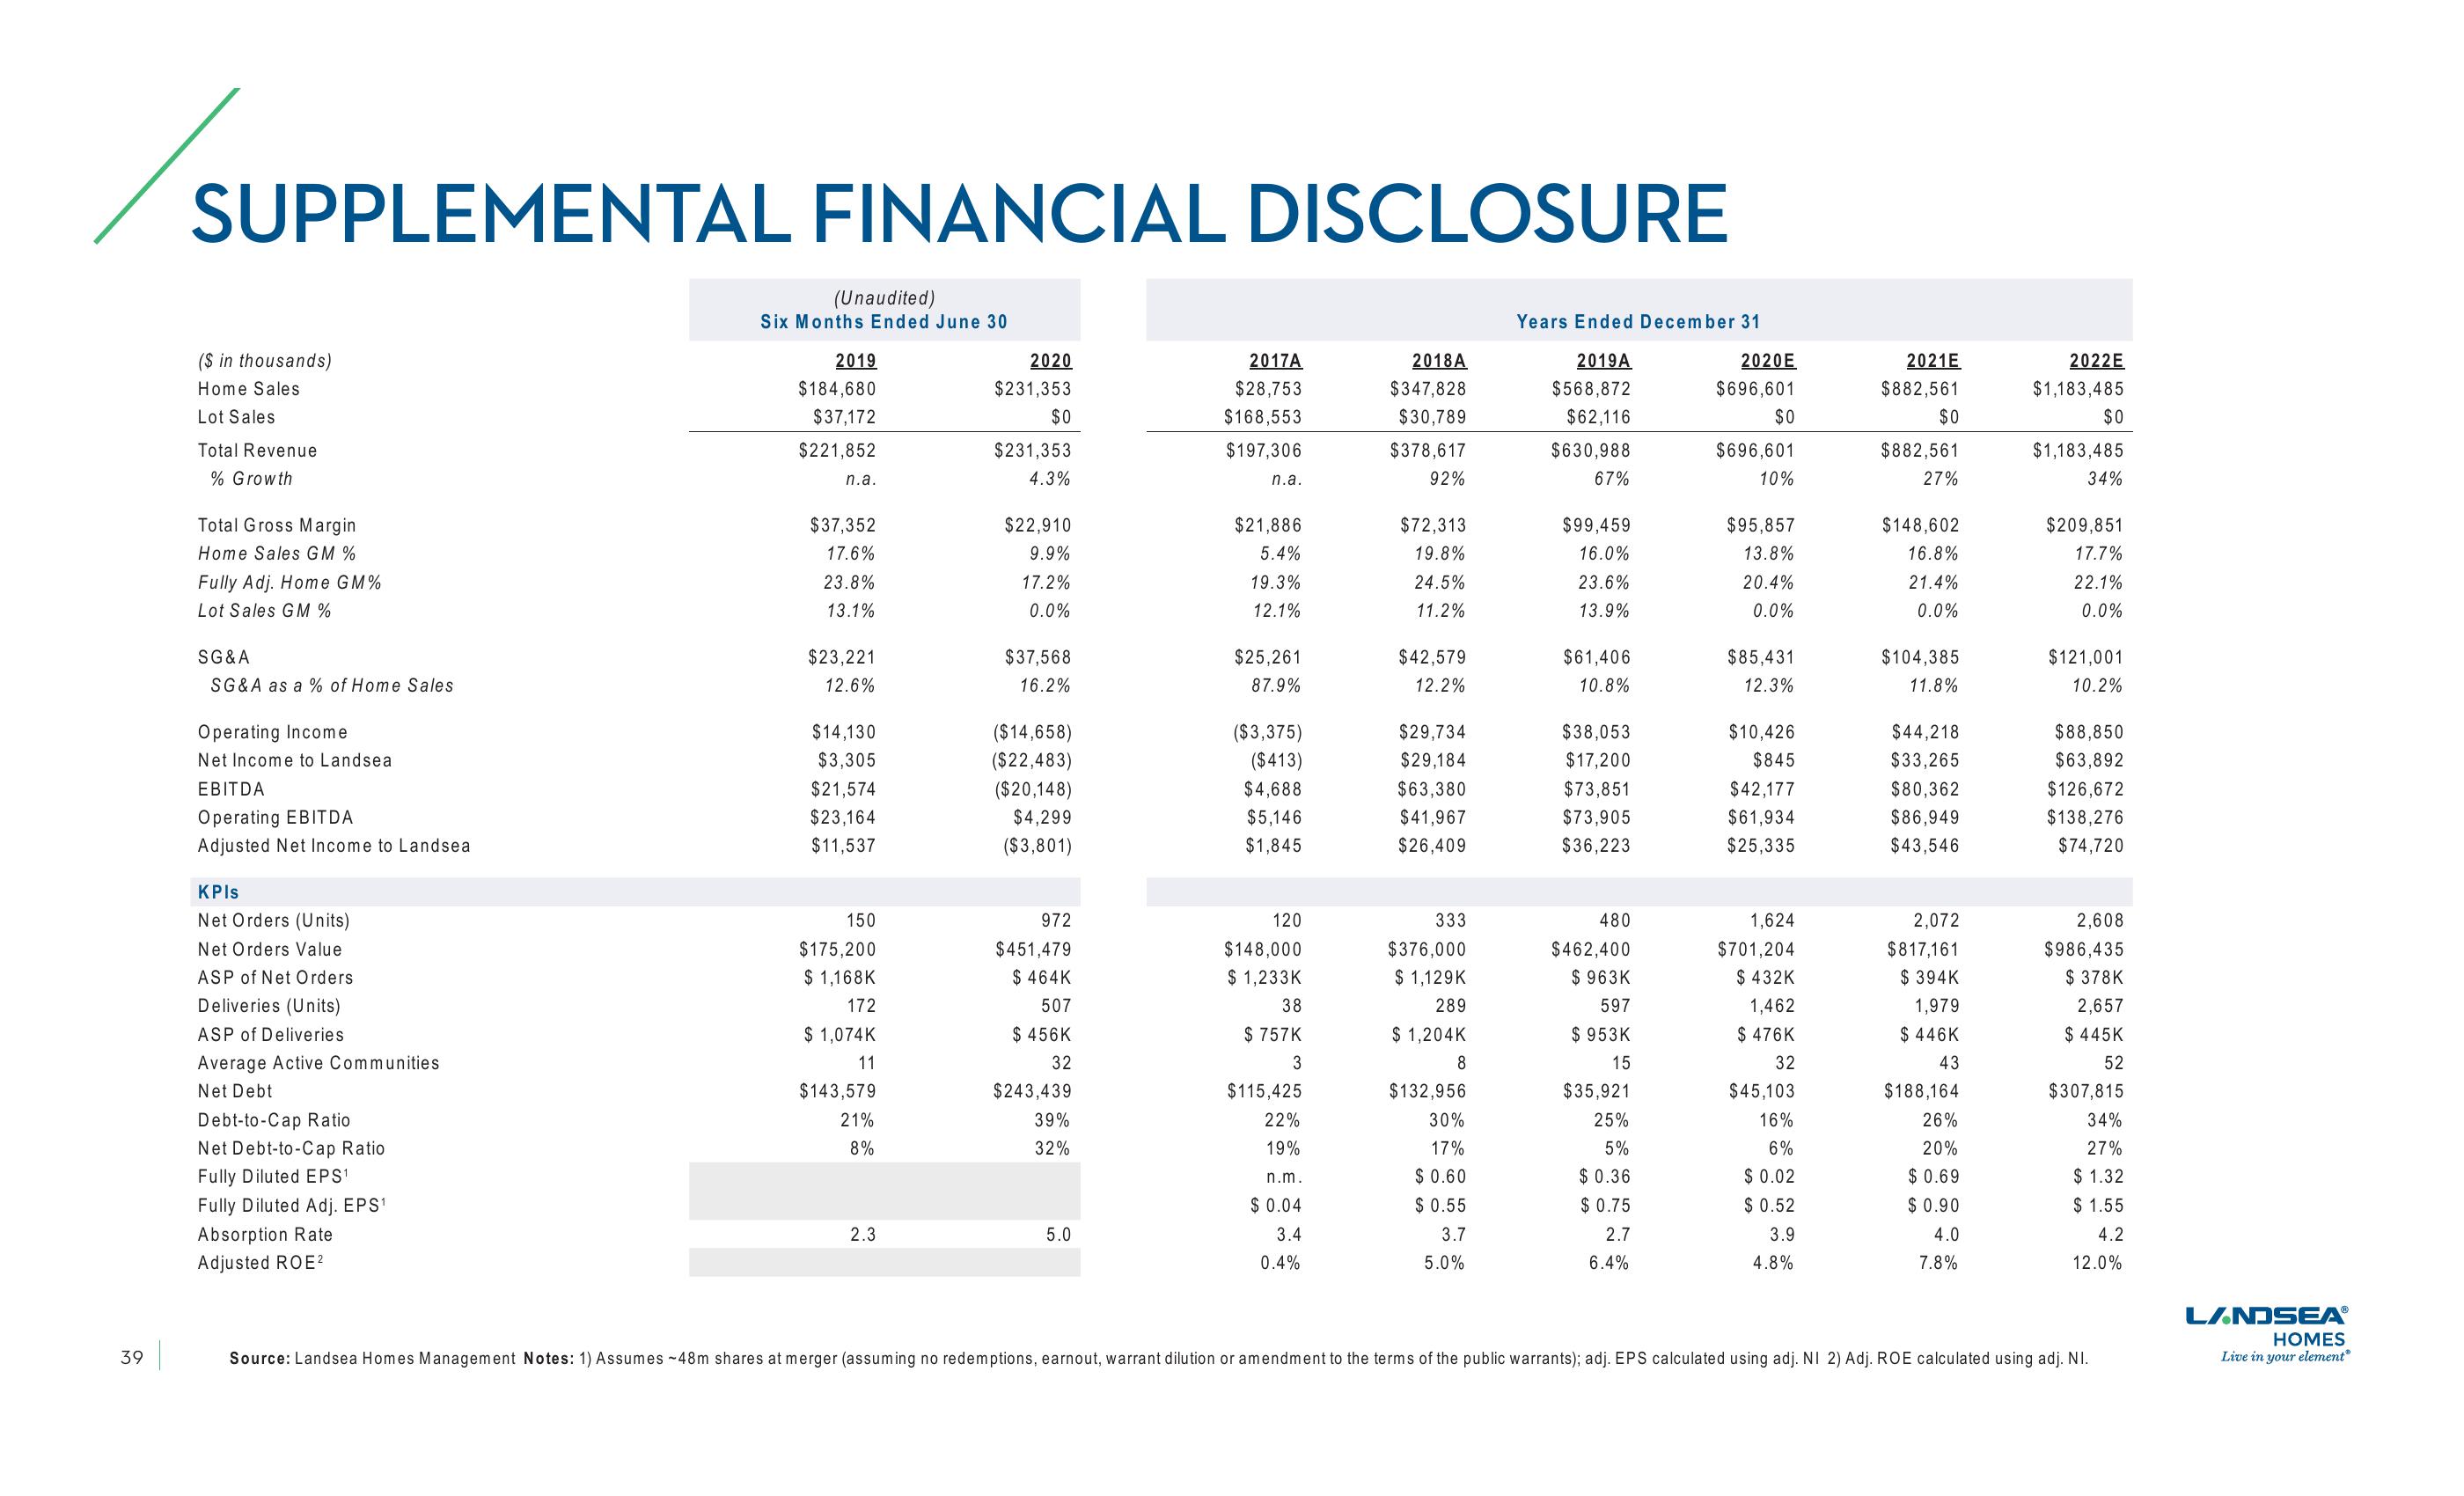
SUPPLEMENTAL FINANCIAL DISCLOSURE
($ in thousands)
Home Sales
Lot Sales
Total Revenue
% Growth
Total Gross Margin
Home Sales GM %
Fully Adj. Home GM%
Lot Sales GM %
SG&A
SG&A as a % of Home Sales
Operating Income
Net Income to Landsea
EBITDA
Operating EBITDA
Adjusted Net Income to Landsea
KPIs
Net Orders (Units)
Net Orders Value
ASP of Net Orders.
Deliveries (Units)
ASP of Deliveries
Average Active Communities
Net Debt
Debt-to-Cap Ratio
Net Debt-to-Cap Ratio
Fully Diluted EPS¹
Fully Diluted Adj. EPS¹
Absorption Rate
Adjusted ROE²
(Unaudited)
Six Months Ended June 30
2019
$184,680
$37,172
$221,852
n.a.
$37,352
17.6%
23.8%
13.1%
$23,221
12.6%
$14,130
$3,305
$21,574
$23,164
$11,537
150
$175,200
$1,168K
172
$ 1,074K
11
$143,579
21%
8%
2.3
2020
$231,353
$0
$231,353
4.3%
$22,910
9.9%
17.2%
0.0%
$37,568
16.2%
($14,658)
($22,483)
($20,148)
$4,299
($3,801)
972
$451,479
$ 464K
507
$ 456K
32
$243,439
39%
32%
5.0
2017A
$28,753
$168,553
$197,306
n.a.
$21,886
5.4%
19.3%
12.1%
$25,261
87.9%
($3,375)
($413)
$4,688
$5,146
$1,845
120
$148,000
$ 1,233K
38
$757K
3
$115,425
22%
19%
n.m.
$ 0.04
3.4
0.4%
2018A
$347,828
$30,789
$378,617
92%
$72,313
19.8%
24.5%
11.2%
$42,579
12.2%
$29,734
$29,184
$63,380
$41,967
$26,409
333
$376,000
$ 1,129K
289
$ 1,204K
8
$132,956
30%
17%
$0.60
$ 0.55
3.7
5.0%
Years Ended December 31
2019A
$568,872
$62,116
$630,988
67%
$99,459
16.0%
23.6%
13.9%
$61,406
10.8%
$38,053
$17,200
$73,851
$73,905
$36,223
480
$462,400
$ 963K
597
$ 953K
15
$35,921
25%
5%
$ 0.36
$0.75
2.7
6.4%
2020E
$696,601
$0
$696,601
10%
$95,857
13.8%
20.4%
0.0%
$85,431
12.3%
$10,426
$845
$42,177
$61,934
$25,335
1,624
$701,204
$432K
1,462
$ 476K
32
$45,103
16%
6%
$ 0.02
$0.52
3.9
4.8%
2021E
$882,561
$0
$882,561
27%
$148,602
16.8%
21.4%
0.0%
$104,385
11.8%
$44,218
$33,265
$80,362
$86,949
$43,546
2,072
$817,161
$ 394K
1,979
$446K
43
$188,164
26%
20%
$0.69
$0.90
4.0
7.8%
2022E
$1,183,485
$0
$1,183,485
34%
$209,851
17.7%
22.1%
0.0%
$121,001
10.2%
$88,850
$63,892
$126,672
$138,276
$74,720
2,608
$986,435
$ 378K
2,657
$ 445K
52
$307,815
34%
27%
$1.32
$ 1.55
4.2
12.0%
Source: Landsea Homes Management Notes: 1) Assumes -48m shares at merger (assuming no redemptions, earnout, warrant dilution or amendment to the terms of the public warrants); adj. EPS calculated using adj. NI 2) Adj. ROE calculated using adj. NI.
LANDSEAⓇ®
HOMES
Live in your element®View entire presentation