Hilltop Holdings Results Presentation Deck
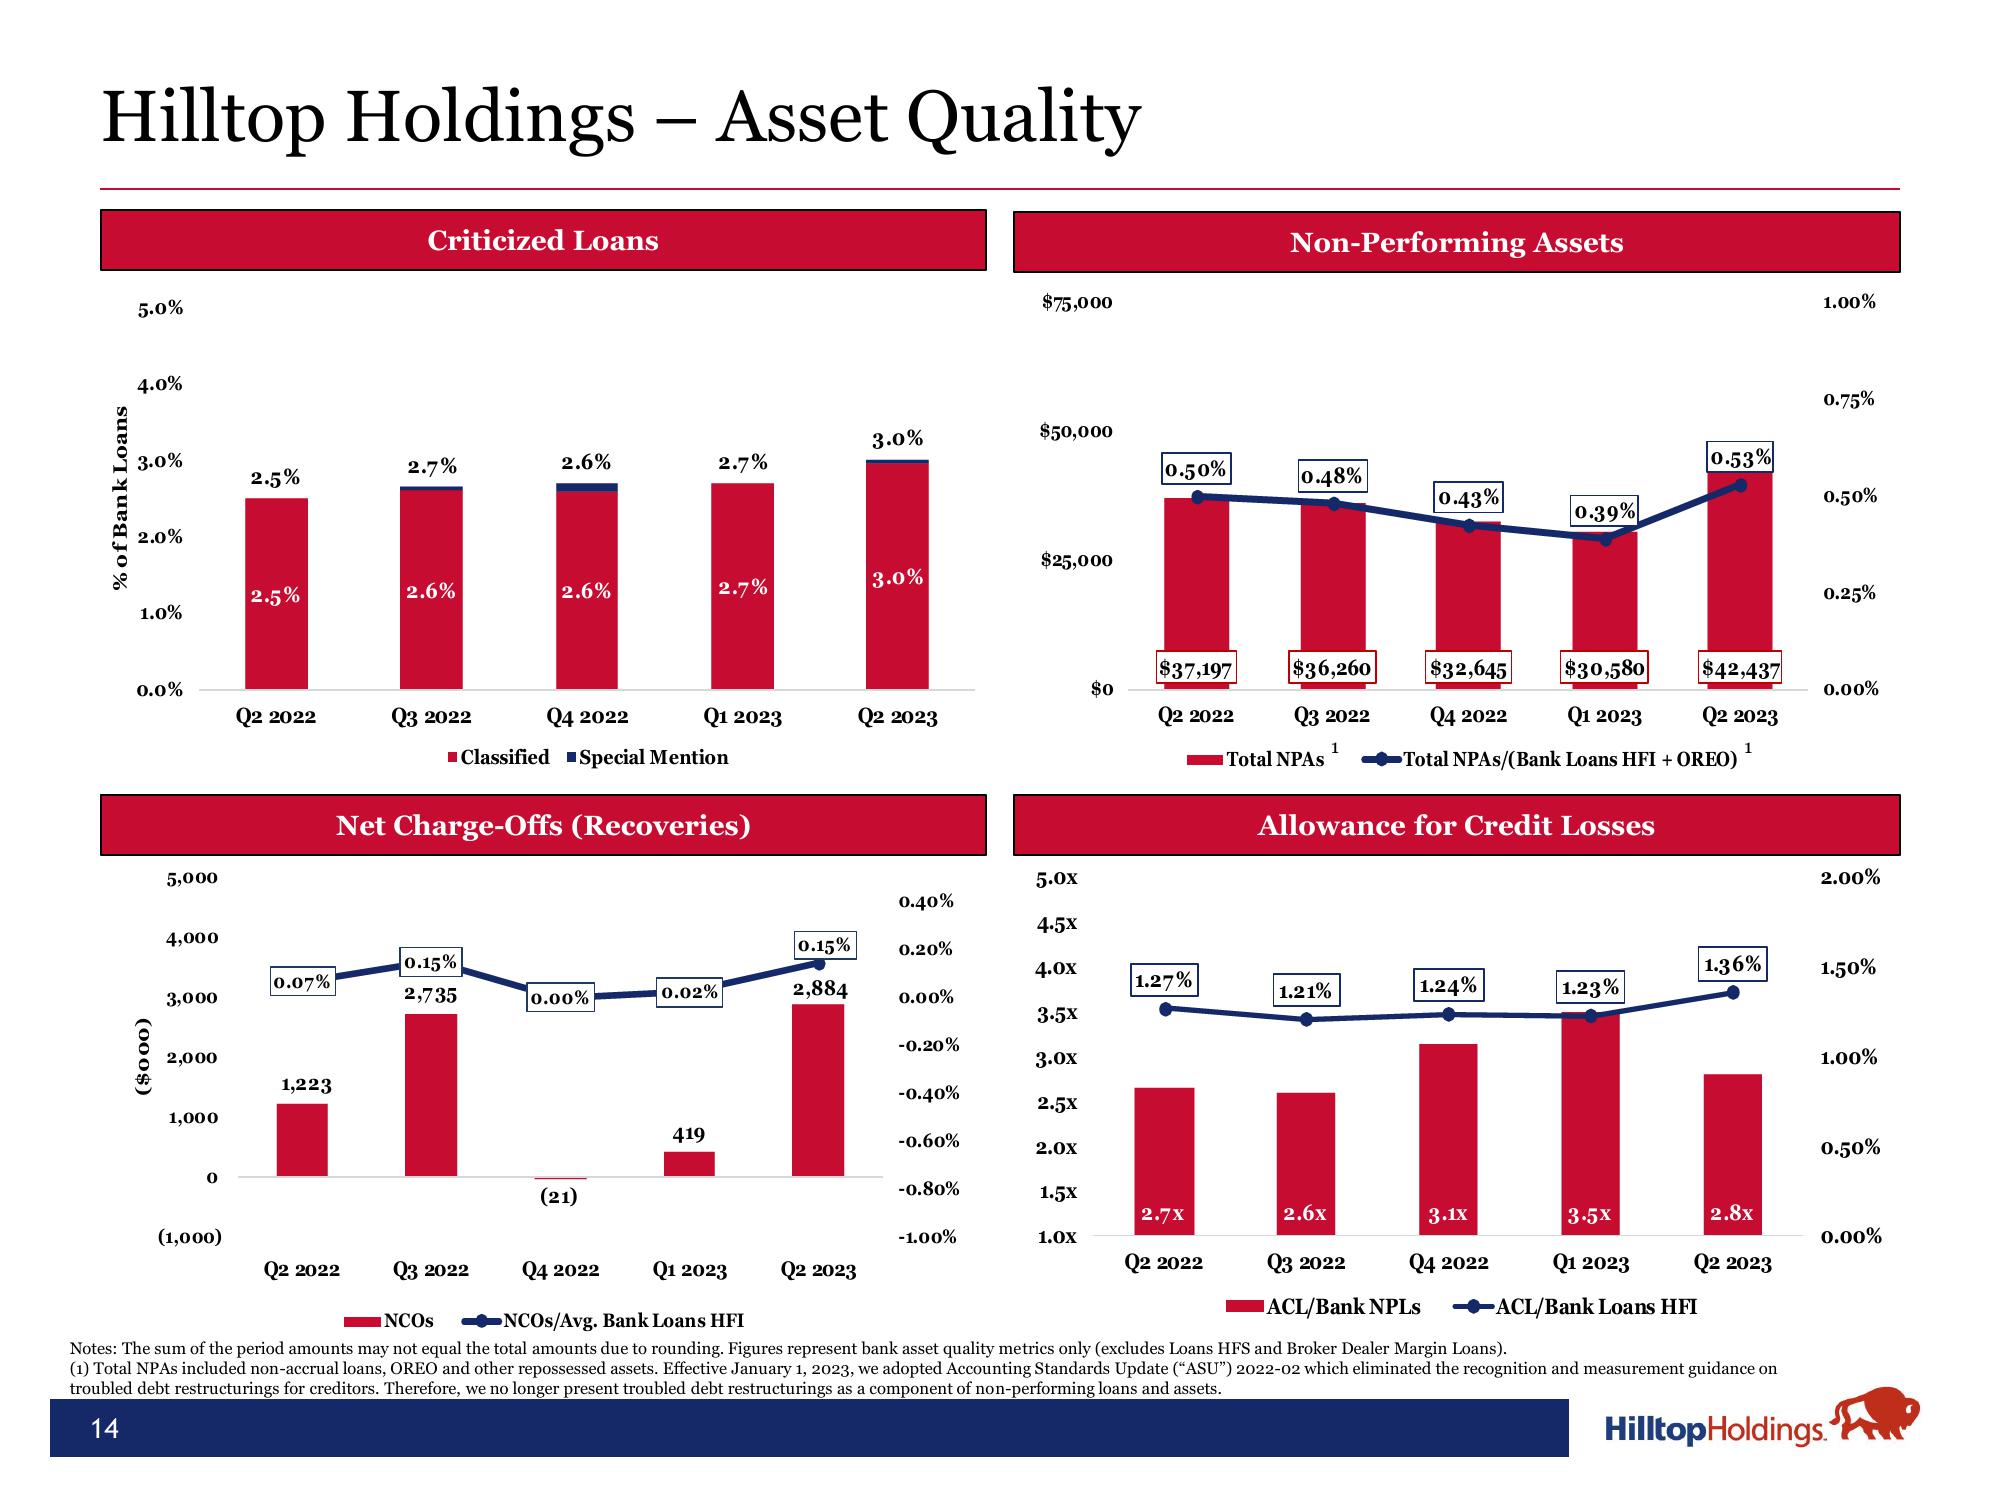
Hilltop Holdings - Asset Quality
% of Bank Loans
5.0%
4.0%
3.0%
2.0%
1.0%
0.0%
($000)
5,000
4,000
3,000
2,000
1,000
0
(1,000)
2.5%
2.5%
Q2 2022
0.07%
1,223
Criticized Loans
2.7%
Q2 2022
2.6%
Q3 2022
2.6%
0.15%
2,735
2.6%
Q4 2022
Classified Special Mention
Net Charge-Offs (Recoveries)
0.00%
(21)
2.7%
Q1 2023
2.7%
0.02%
419
0.15%
2,884
3.0%
3.0%
Q2 2023
Q2 2023
0.40%
0.20%
0.00%
-0.20%
-0.40%
-0.60%
-0.80%
-1.00%
$75,000
$50,000
$25,000
5.0x
4.5X
4.0x
3.5X
3.0x
2.5X
2.0X
1.5X
1.0X
$0
0.50%
$37,197
Q2 2022
1.27%
2.7X
Q2 2022
Non-Performing Assets
0.48%
$36,260
Q3 2022
Total NPAS
1
1.21%
2.6x
0.43%
Allowance for Credit Losses
0.39%
$32,645 $30,580
Q4 2022 Q1 2023
Total NPAs/(Bank Loans HFI + OREO)
1.24%
3.1x
1.23%
3.5x
0.53%
$42,437
Q2 2023
1
Q1 2023
ACL/Bank Loans HFI
1.36%
2.8x
Q2 2023
1.00%
0.75%
0.50%
0.25%
0.00%
2.00%
1.50%
Q3 2022 Q4 2022
ACL/Bank NPLs
Q3 2022 Q4 2022 Q1 2023
INCOS -NCOS/Avg. Bank Loans HFI
Notes: The sum of the period amounts may not equal the total amounts due to rounding. Figures represent bank asset quality metrics only (excludes Loans HFS and Broker Dealer Margin Loans).
(1) Total NPAs included non-accrual loans, OREO and other repossessed assets. Effective January 1, 2023, we adopted Accounting Standards Update ("ASU") 2022-02 which eliminated the recognition and measurement guidance on
troubled debt restructurings for creditors. Therefore, we no longer present troubled debt restructurings as a component of non-performing loans and assets.
14
Hilltop Holdings.
1.00%
0.50%
0.00%View entire presentation