NVIDIA Investor Presentation Deck
3x
2x
1x
Ox
1.2x
0.7x
1x
1.5x
Image Classification
ResNet-50 v.1.5
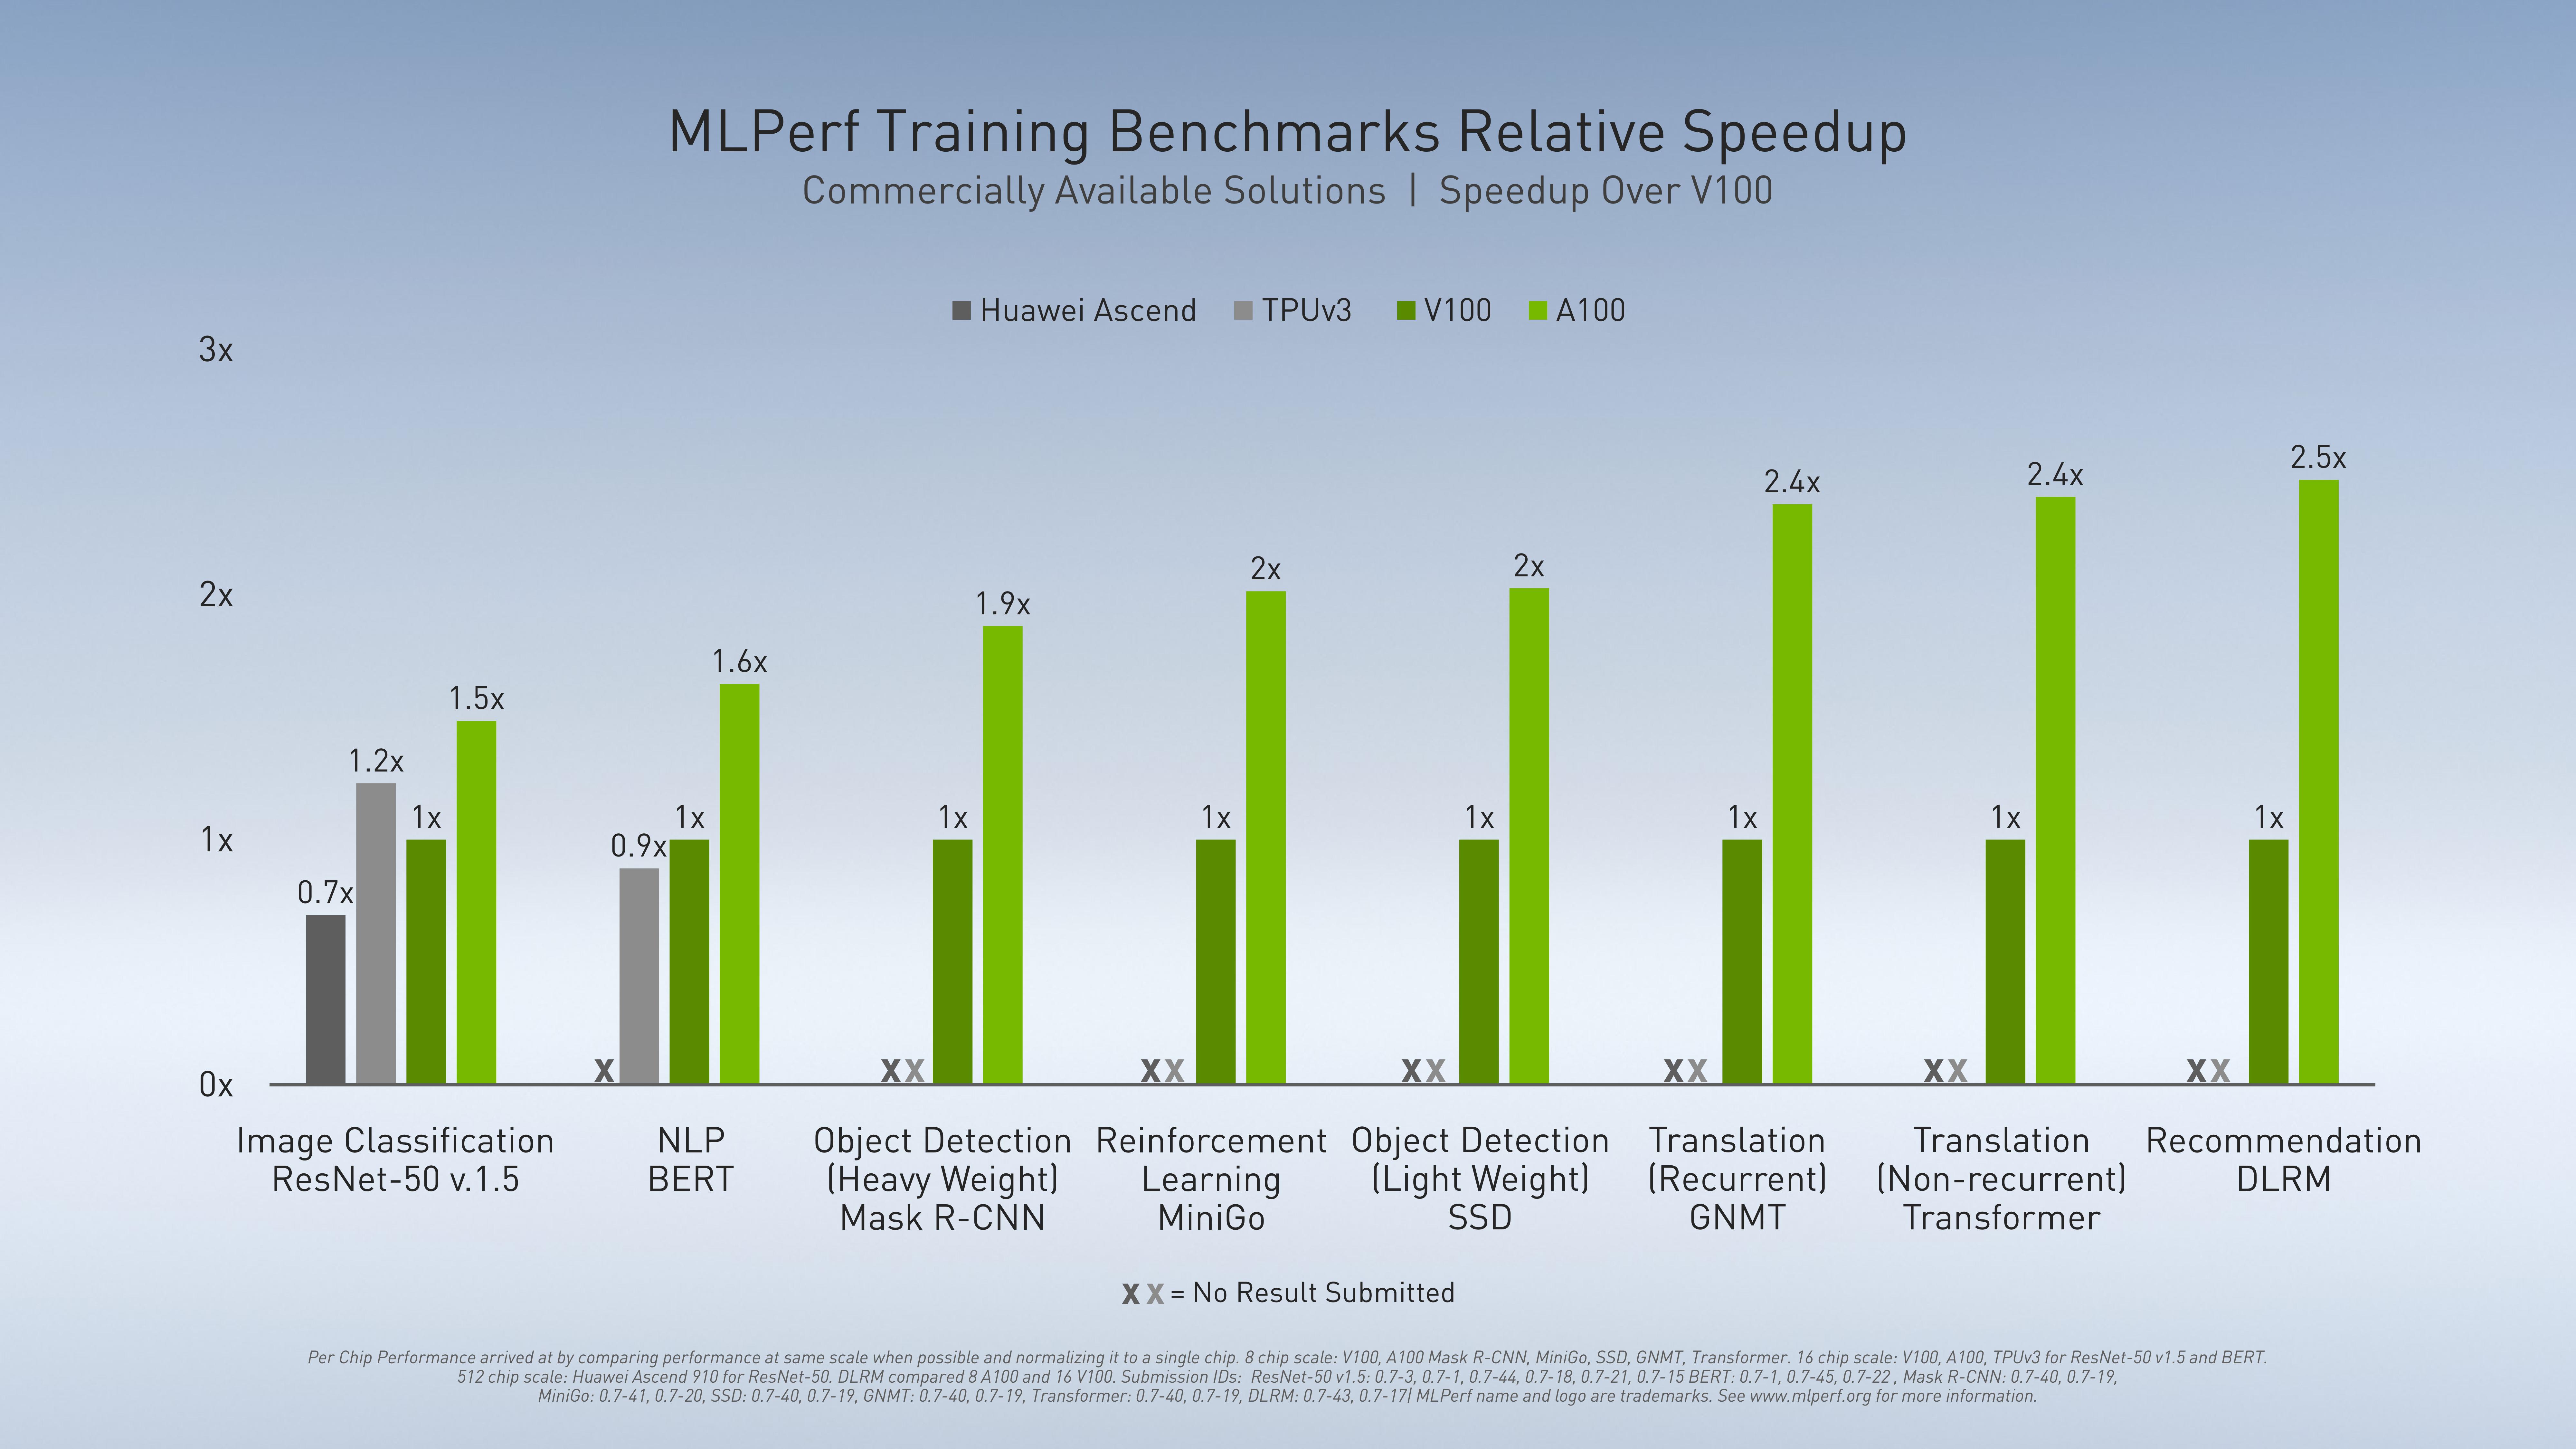
MLPerf Training Benchmarks Relative Speedup
Commercially Available Solutions | Speedup Over V100
0.9x
1x
1.6x
NLP
BERT
XX
1x
Huawei Ascend ■TPUv3 ■V100 A100
1.9x
XX
1x
2x
1x
2x
XX
Object Detection Reinforcement Object Detection
(Heavy Weight) Learning (Light Weight)
Mask R-CNN
MiniGo
SSD
XX
1x
2.4x
Translation
(Recurrent)
GNMT
XX
2.4x
1x
Translation
(Non-recurrent)
Transformer
XX
1x
2.5x
Recommendation
DLRM
XX = No Result Submitted
Per Chip Performance arrived at by comparing performance at same scale when possible and normalizing it to a single chip. 8 chip scale: V100, A100 Mask R-CNN, MiniGo, SSD, GNMT, Transformer. 16 chip scale: V100, A100, TPUv3 for ResNet-50 v1.5 and BERT.
512 chip scale: Huawei Ascend 910 for ResNet-50. DLRM compared 8 A 100 and 16 V100. Submission IDs: ResNet-50 v1.5: 0.7-3, 0.7-1, 0.7-44, 0.7-18, 0.7-21, 0.7-15 BERT: 0.7-1, 0.7-45, 0.7-22, Mask R-CNN: 0.7-40, 0.7-19,
MiniGo: 0.7-41, 0.7-20, SSD: 0.7-40, 0.7-19, GNMT: 0.7-40, 0.7-19, Transformer: 0.7-40, 0.7-19, DLRM: 0.7-43, 0.7-171 ML Perf name and logo are trademarks. See www.mlperf.org for more information.View entire presentation