Tudor, Pickering, Holt & Co Investment Banking
Discount Rate
Discount Rate
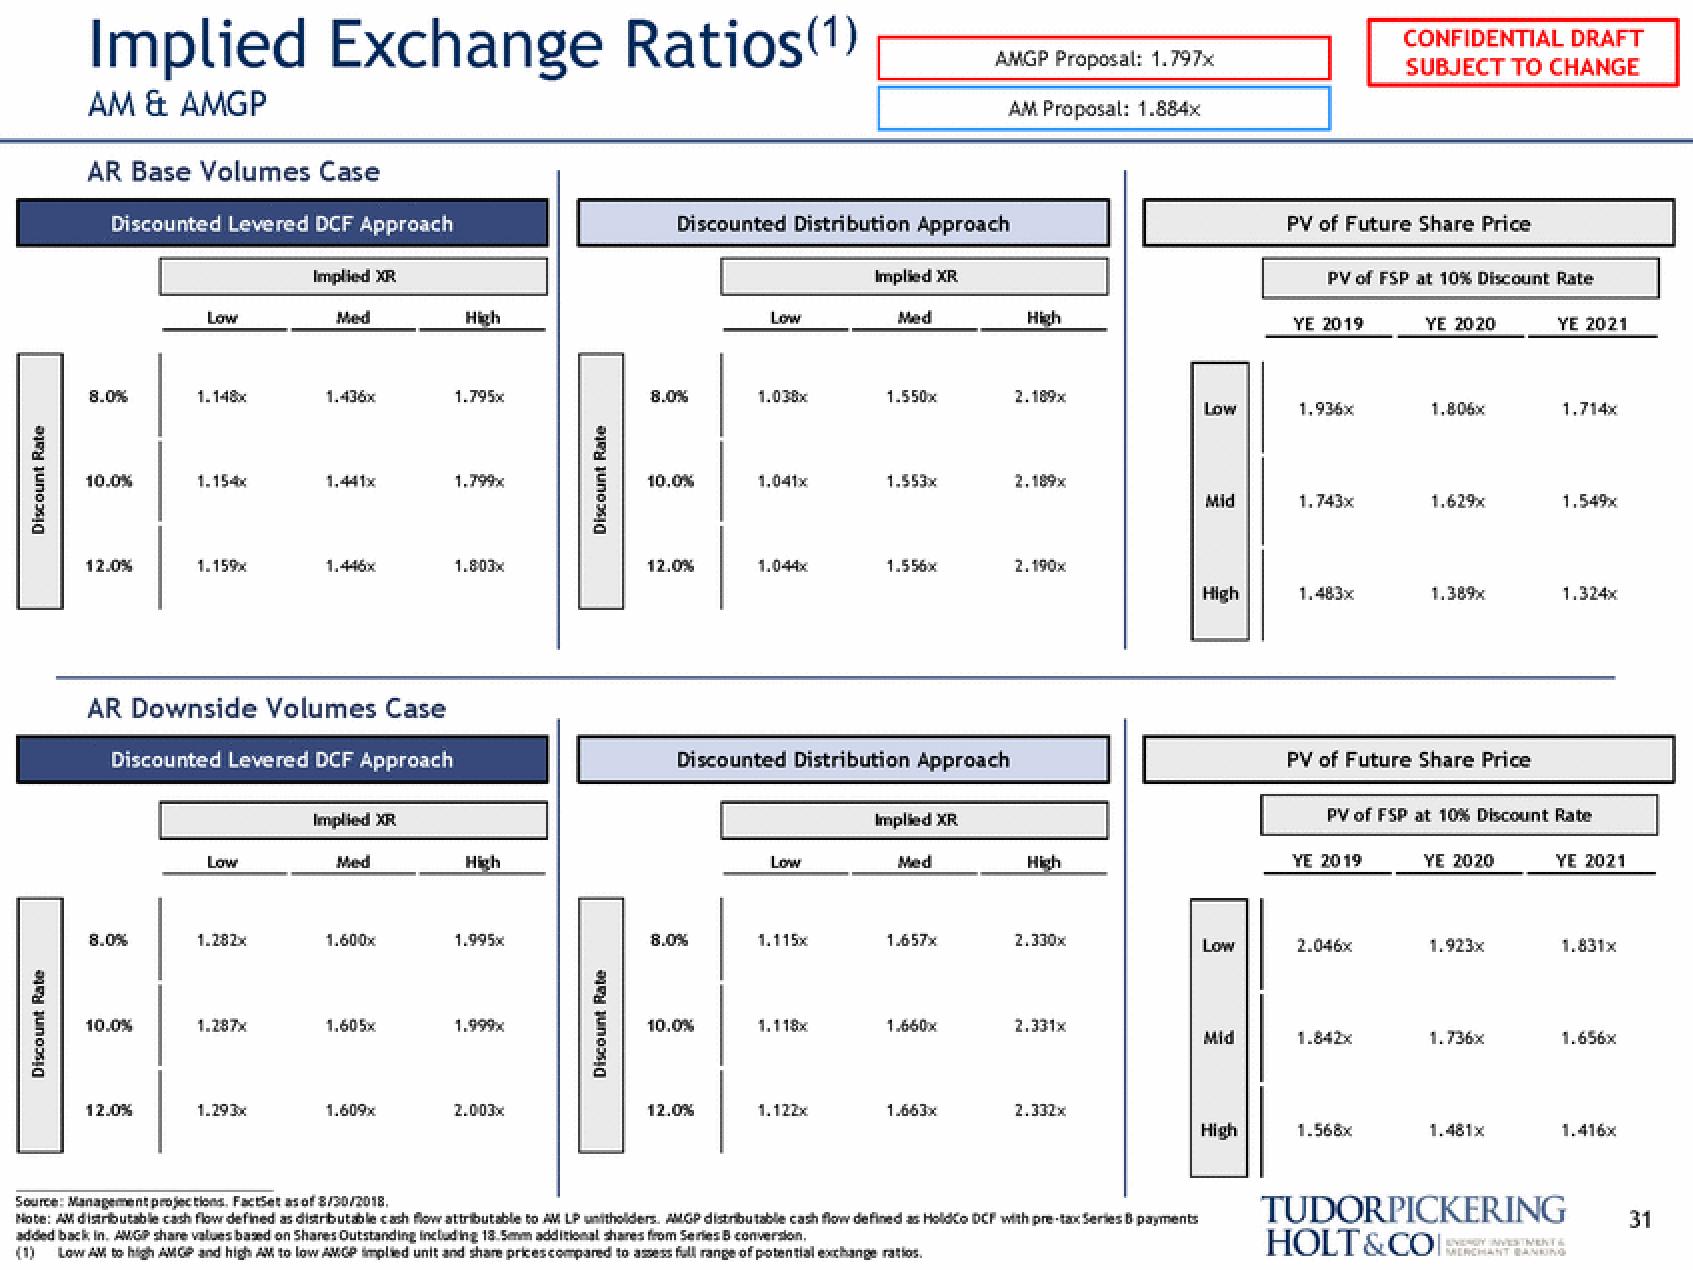
Implied Exchange Ratios(1)
AM & AMGP
AR Base Volumes Case
Discounted Levered DCF Approach
8.0%
10.0%
12.0%
8.0%
10.0%
Low
12.0%
1.148x
1.154x
1.159x
AR Downside Volumes Case
Discounted Levered DCF Approach
Low
1.282x
1.287x
Implied XR
1.293x
1.436x
1.446x
Implied XR
Med
1.600x
1.605x
1.609x
High
1.795x
1.803x
High
1.995x
1.999x
2.003x
Discount Rate
Discount Rate
Discounted Distribution Approach
8.0%
10.0%
12.0%
8.0%
10.0%
Low
12.0%
1.038x
1.041x
Low
1.115x
Discounted Distribution Approach
1.118x
Implied XR
1.122x
Med
1.550x
1.553x
1.556x
Implied XR
Med
1.657x
AMGP Proposal: 1.797x
AM Proposal: 1.884x
1.660x
1.663x
High
2.189x
2.189x
2.190x
2.330x
2.331x
2.332x
Source: Management projections. FactSet as of 8/30/2018.
Note: AM distributable cash flow defined as distributable cash flow attributable to AM LP unitholders. AMGP distributable cash flow defined as HoldCo DCF with pre-tax Series B payments
added back in AMGP share values based on Shares Outstanding including 13.5mm additional shares from Series B conversion.
Low AM to high AMGP and high AM to low AMGP implied unit and share prices compared to assess full range of potential exchange ratios.
Low
Mid
High
Low
Mid
High
PV of Future Share Price
PV of FSP at 10% Discount Rate
YE 2019
1.936x
1.743x
1.483x
CONFIDENTIAL DRAFT
SUBJECT TO CHANGE
YE 2019
2.046x
1.842x
YE 2020
PV of Future Share Price
1.568x
1.806x
1.629x
1.389x
PV of FSP at 10% Discount Rate
YE 2020
1.923x
1.736x
YE 2021
1.481x
1.714x
1.549x
1.324x
YE 2021
1.831x
1.656x
1.416x
TUDORPICKERING
HOLT&COI:
ENERGY INVESTMENTS
MERCHANT BANKING
31View entire presentation