Kinnevik Results Presentation Deck
Intro
Net Asset Value
In assessing our valuations per end of Q1 2022, we are not taking into
consideration private markets potentially lagging behind public markets,
but seek to wholly reflect the end of March valuation levels of publicly
listed peers when valuing our younger, faster-growing unlisted businesses.
In reflecting the public market correction, we believe this impacts later
stage companies more adversely than earlier stage companies. We also
see clear indications of the public market contraction bearing less effect
on companies regarded as leading businesses in their respective sector
or business area. The best performing businesses typically, but not always,
overlap with the companies that have raised the most equity financing
and therefore have the strongest balance sheets and longest runways.
This makes them less dependent on the near-term funding climate, and
provides for more robust valuations. In our valuations, we take all these
parameters into consideration.
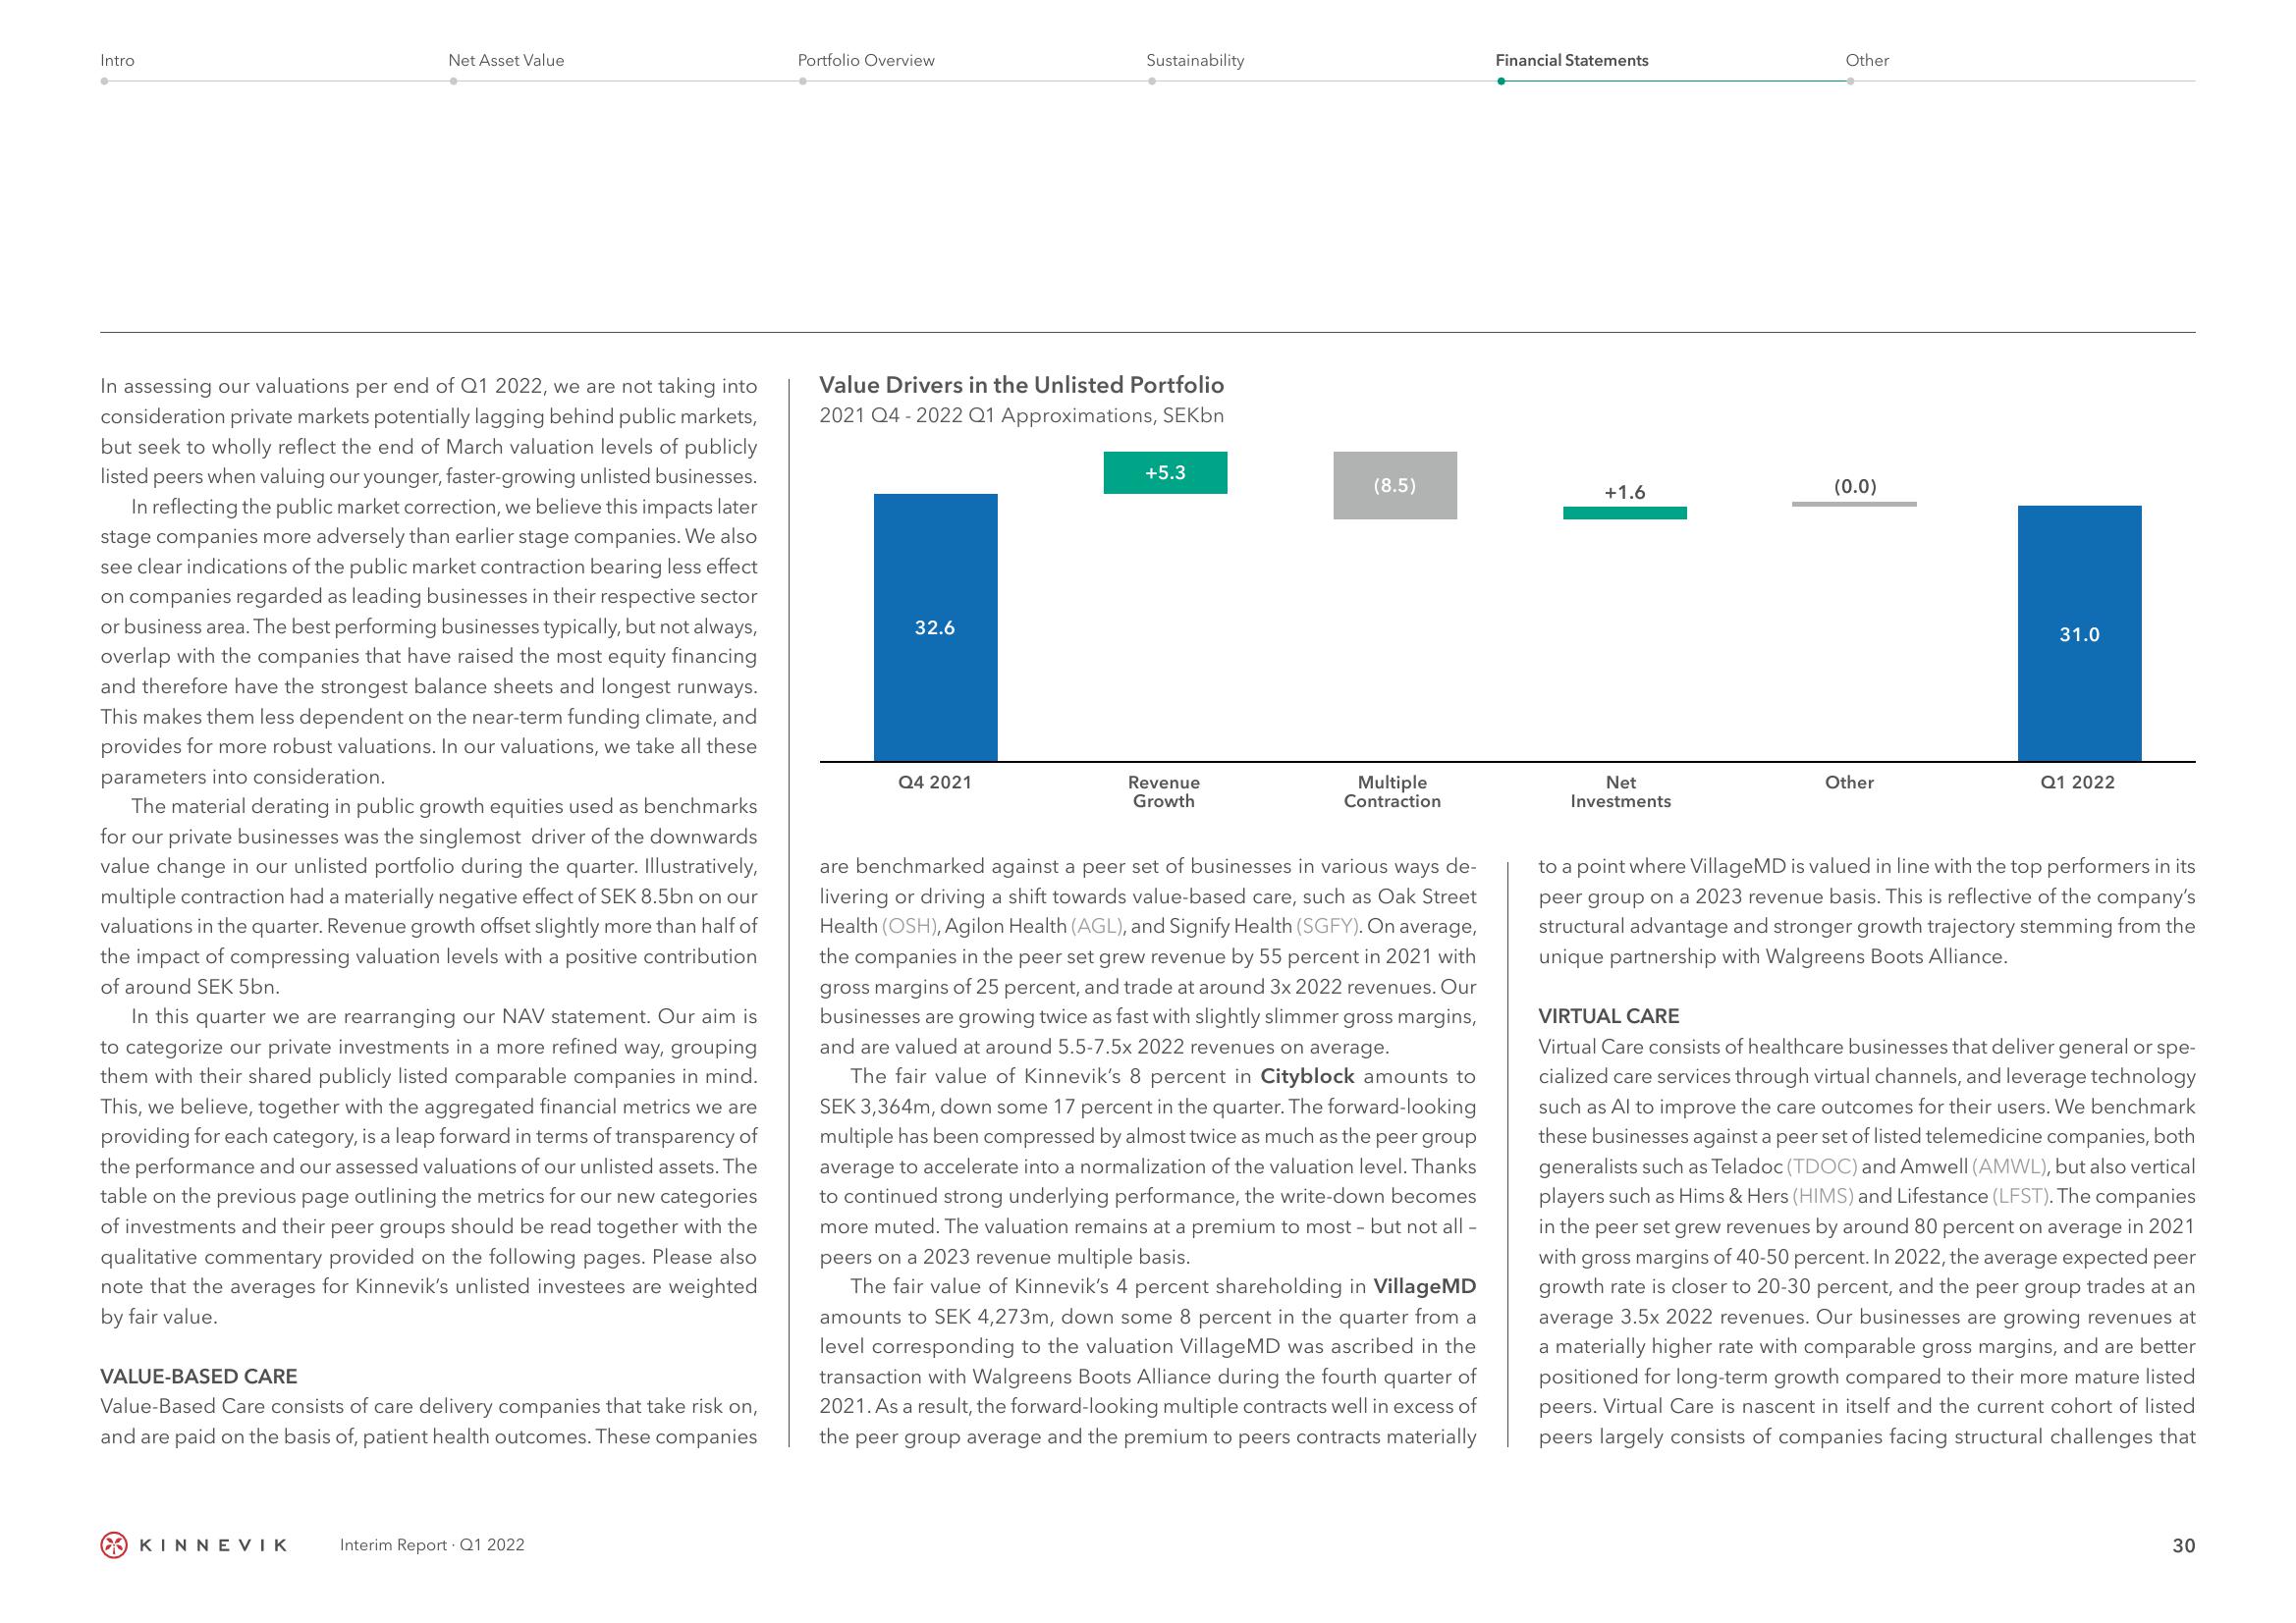
The material derating in public growth equities used as benchmarks
for our private businesses was the singlemost driver of the downwards
value change in our unlisted portfolio during the quarter. Illustratively,
multiple contraction had a materially negative effect of SEK 8.5bn on our
valuations in the quarter. Revenue growth offset slightly more than half of
the impact of compressing valuation levels with a positive contribution
of around SEK 5bn.
In this quarter we are rearranging our NAV statement. Our aim is
to categorize our private investments in a more refined way, grouping
them with their shared publicly listed comparable companies in mind.
This, we believe, together with the aggregated financial metrics we are
providing for each category, is a leap forward in terms of transparency of
the performance and our assessed valuations of our unlisted assets. The
table on the previous page outlining the metrics for our new categories
of investments and their peer groups should be read together with the
qualitative commentary provided on the following pages. Please also
note that the averages for Kinnevik's unlisted investees are weighted
by fair value.
VALUE-BASED CARE
Value-Based Care consists of care delivery companies that take risk on,
and are paid on the basis of, patient health outcomes. These companies
KINNEVIK
Interim Report Q1 2022
Portfolio Overview
Value Drivers in the Unlisted Portfolio
2021 Q4-2022 Q1 Approximations, SEKbn
32.6
Sustainability
Q4 2021
+5.3
Revenue
Growth
(8.5)
Multiple
Contraction
are benchmarked against a peer set of businesses in various ways de-
livering or driving a shift towards value-based care, such as Oak Street
Health (OSH), Agilon Health (AGL), and Signify Health (SGFY). On average,
the companies in the peer set grew revenue by 55 percent in 2021 with
gross margins of 25 percent, and trade at around 3x 2022 revenues. Our
businesses are growing twice as fast with slightly slimmer gross margins,
and are valued at around 5.5-7.5x 2022 revenues on average.
The fair value of Kinnevik's 8 percent in Cityblock amounts to
SEK 3,364m, down some 17 percent in the quarter. The forward-looking
multiple has been compressed by almost twice as much as the peer group
average to accelerate into a normalization of the valuation level. Thanks
to continued strong underlying performance, the write-down becomes
more muted. The valuation remains at a premium to most - but not all -
peers on a 2023 revenue multiple basis.
The fair value of Kinnevik's 4 percent shareholding in VillageMD
amounts to SEK 4,273m, down some 8 percent in the quarter from a
level corresponding to the valuation Village MD was ascribed in the
transaction with Walgreens Boots Alliance during the fourth quarter of
2021. As a result, the forward-looking multiple contracts well in excess of
the peer group average and the premium to peers contracts materially
Financial Statements
+1.6
Net
Investments
Other
(0.0)
Other
31.0
Q1 2022
to a point where VillageMD is valued in line with the top performers in its
peer group on a 2023 revenue basis. This is reflective of the company's
structural advantage and stronger growth trajectory stemming from the
unique partnership with Walgreens Boots Alliance.
VIRTUAL CARE
Virtual Care consists of healthcare businesses that deliver general or spe-
cialized care services through virtual channels, and leverage technology
such as Al to improve the care outcomes for their users. We benchmark
these businesses against a peer set of listed telemedicine companies, both
generalists such as Teladoc (TDOC) and Amwell (AMWL), but also vertical
players such as Hims & Hers (HIMS) and Lifestance (LFST). The companies
in the peer set grew revenues by around 80 percent on average in 2021
with gross margins of 40-50 percent. In 2022, the average expected peer
growth rate is closer to 20-30 percent, and the peer group trades at an
average 3.5x 2022 revenues. Our businesses are growing revenues at
a materially higher rate with comparable gross margins, and are better
positioned for long-term growth compared to their more mature listed
peers. Virtual Care is nascent in itself and the current cohort of listed
peers largely consists of companies facing structural challenges that
30View entire presentation