Jefferies Financial Group Investor Day Presentation Deck
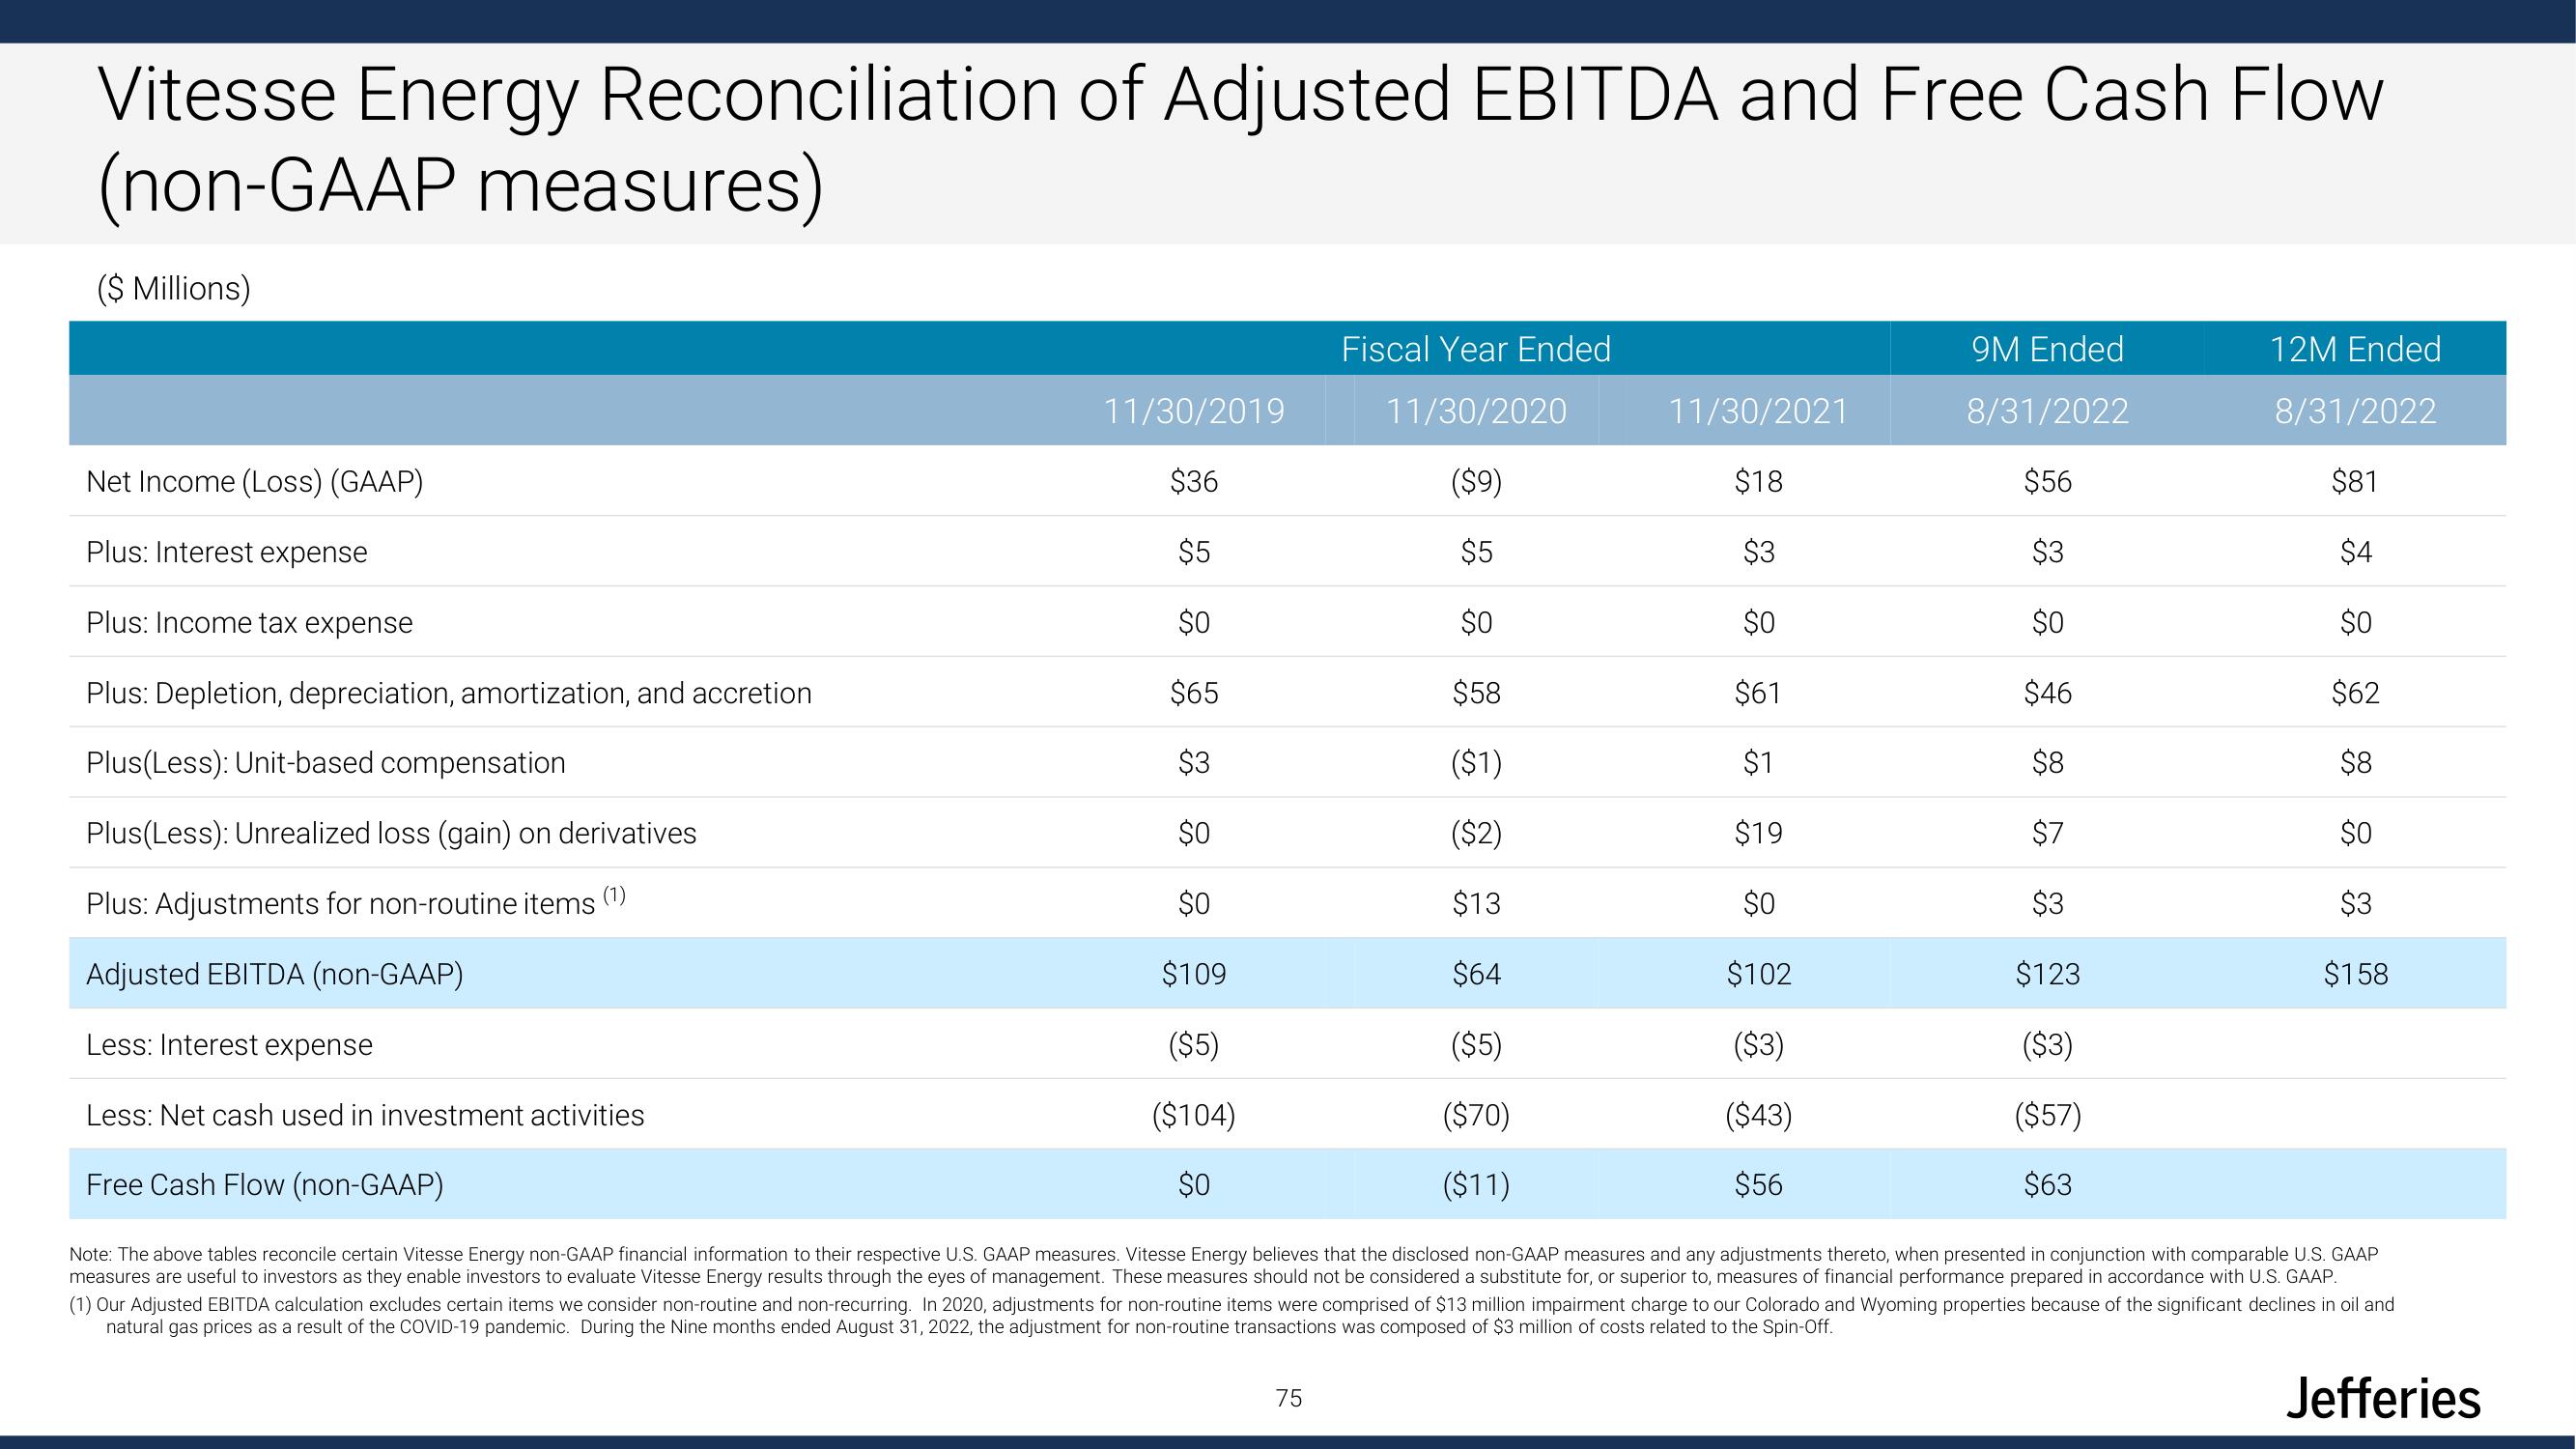
Vitesse Energy Reconciliation of Adjusted EBITDA and Free Cash Flow
(non-GAAP measures)
($ Millions)
Net Income (Loss) (GAAP)
Plus: Interest expense
Plus: Income tax expense
Plus: Depletion, depreciation, amortization, and accretion
11/30/2019
$36
$5
$0
$65
$3
$0
$0
$109
($5)
($104)
$0
Fiscal Year Ended
11/30/2020
($9)
$5
$0
$58
($1)
($2)
$13
$64
($5)
($70)
($11)
75
11/30/2021
$18
$3
$0
$61
$1
$19
$0
$102
($3)
($43)
$56
9M Ended
8/31/2022
$56
$3
$0
$46
$8
$7
$3
$123
($3)
($57)
$63
12M Ended
8/31/2022
$81
$4
$0
$62
$8
$0
$3
$158
Plus(Less): Unit-based compensation
Plus (Less): Unrealized loss (gain) on derivatives
(1)
Plus: Adjustments for non-routine items
Adjusted EBITDA (non-GAAP)
Less: Interest expense
Less: Net cash used in investment activities
Free Cash Flow (non-GAAP)
Note: The above tables reconcile certain Vitesse Energy non-GAAP financial information to their respective U.S. GAAP measures. Vitesse Energy believes that the disclosed non-GAAP measures and any adjustments thereto, when presented in conjunction with comparable U.S. GAAP
measures are useful to investors as they enable investors to evaluate Vitesse Energy results through the eyes of management. These measures should not be considered a substitute for, or superior to, measures of financial performance prepared in accordance with U.S. GAAP.
(1) Our Adjusted EBITDA calculation excludes certain items we consider non-routine and non-recurring. In 2020, adjustments for non-routine items were comprised of $13 million impairment charge to our Colorado and Wyoming properties because of the significant declines in oil and
natural gas prices as a result of the COVID-19 pandemic. During the Nine months ended August 31, 2022, the adjustment for non-routine transactions was composed of $3 million of costs related to the Spin-Off.
JefferiesView entire presentation